Tuesday, June 30, 2015

More on the MR model...06.30.15

We're up today but its still iffy out there as Tsipras pulled a rabbit out of the hat this weekend and postponed the Greek crisis for yet another week.....which is ending up looking like a replay of Groundhog Day (the movie).  It would have be great to be short Monday morning but that's not what the models signaled and we were lucky to cut our losses on the 3DL model's SPY position to just .6%....illustrating the effectiveness of our limit stop approach versus a a simple cash stop.
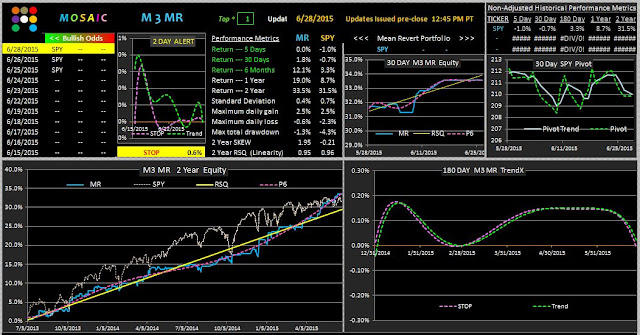
Meanwhile, work on the MR (mean reversion) model continues, with several new features and rather interesting results.  Below are a few examples of how MR works. The auto-stop feature has been re-programmed so that the MR algorithm can be turned on or off, enabling us to compare performance metrics for either a momentum based or mean reversion based algorithm with a single click.
The first two panels show a binary model of SPY and SH.
The first panel is the momentum based version, the second is the mean reversion version.

This is more than a bit surprising to me We can make money using either tactic....now we just have to figure out how to filter out the "noise" of low probability trades and focus capital on the higher odds trades.  One way we can pursue this line of inquiry is to expand our universe of securuites by adding on outlier that has some momentum and mean reverting behavior relative to SPY.   There's a number of possibilities to consider but the following panels show what happens with XLU (utilities) added to the mix.
First as a momentum model and then as a mean reverting version. Note that in the second version I've selected Top 2....meaning we switch to the top 2 ranked issues at each close. This little tweak gives the model the best linearity of the bunch and also the lowest Max drawdown...a metric we are ALWAYS concerned about.  Work continues on variations of the MR model with the goal of making it the main workhorse in our stable.  


Monday, June 29, 2015

A New Mean Reversion Model .....MR....06.29.15

Even if you were a talented fiction writer you couldn't come up with the plot twists we saw over the weekend in the on-going Greek tragic comedy. (see Briefing.com piece at the end of this post).
Meanwhile I've been working on a new model than incorporates elements of the 3 day low model and a more true mean version algorithm.  We'll be adding this model ...MR...to our daily signal update as it provides a completely different take on market dynamics than the LM and M3, which are momentum and relative strength based. As you may see in the screen shots below the model has a number of permutations.  We can simply look at a single equity...such as SPY, or we look at several issues such as SPY, QQQ and IWM to see if there exists a market wide mean reversion dynamic in effect.  We'll post a few more variations of  MR in the coming days including a long/short version. Once again, our goal is risk mitigation and maximizing the RSQ linearity of the equity curve and MR looks promising in that regard so far.


Saturday, June 27, 2015

VDX Updates for SPY, XIV and XLU....06.27.15

Here are the current MoDx views of SPY, XIV and XLU.  Keep in mind these are technical perspectives and reflect how we might expect the markets to work if all things were equal....which is clearly not the case as the Greek situation continues to fester.  Here's a link to Mauldin's spin on the Greeks...it's definitive and exhaustive and is issued by truly one of the smartest guys in the room.
The MoDx (Mosaic version of the VDX) shows that XIV is actually behaving in a more technically aligned fashion than SPY, something we don't see that often (note that the skew in both is bearish) Meanwhile, I've included the XLU (utilities) chart as it represents a high probability buying situation.
HOWEVER, I mentioned in the M3 login page at Friday's close that although the Greek bailout deadline is June 30th, Merkel has stated that a deal MUST BE completed by Saturday night or bad things will happen (yet to be determined).  As such we should expect Monday's open to be volatile and explosive (big range).  Can't say which way it will blow but just a cautionary note for those that like to ride wild moves.


Thursday, June 25, 2015

Break...06.25.15

The question at yesterday's close was resolved to the downside today as SPY pursued a slow grind down into the close with a little double bottom at S1.  Caused by what??????   Economic reports were net positive, BUT the Greeks are still up in air (no surprise) and with the FINAL deadline looming on June 30th ...Tuesday... we can expect wild gyrations until and likely after that date as doubts ebb and flow regarding the success of the bailout program.
Tomorrow is Friday, historically 70% down, and today's close offers some support for that thesis.
We reiterate our premise that next Wednesday is the best odds date for the bulls, discounting the effects of the Greek situation. Our models are net neutral (in cash) with the technical signals diametrically opposed....of the 4 models posted today...2 in cash, one in SPY and one in SH.
Some days are like that and until the smoke clears its best to stand back or trade small.  The current short term bias (2-3 days) is bearish.
 And the daily TRENDX signal....................

Wednesday, June 24, 2015

Make or Break...06.24.15

We did see our expected weakness for the week, with SPY retreating to a bearish S3 level for the last 2 hours of the day.  See 3 minute and 2 hour bar charts below.  Ergodics and ADX were divergent on about 60% normal volume, reflecting market instability.  We're now poised at a technical make or break level (see yellow line on 2 hour).  Unfortunately, there are no apparent prime movers to drive the markets one way or the other.  The Greek situation still has some traders feeling the jitters, but as Dave Moenning pointed out today...Greece has an economy the size of Dallas, so it's more the principle of the thing and the fear of a larger trickle down effect if there is a default.
On the up side we're approaching the end of the month although it may be until the actual 1st of the month (next Wednesday) before the typical bullish pop transpires.
This year July 4th is on Saturday so no free lunch for traders.


Tuesday, June 23, 2015

PONZO Updates for SPY, QQQ an XLF......06.23.15

A red bias today as once again (you can't make this stuff up) the Greek bailout is cloudy.  Dave's got another great post on the subject and I'm sure this ain't the last word on the subject. Being somewhat of a conspiracy nut I wonder if the Greeks don't know exactly what their next bi-polar pronouncement will be and are front running the markets accordingly.  If they do it enough times the central banks will make enough money to actually get them out of debt.  Hey!, stranger (and truer) things have happened. That's how Rothschild made his fortune (betting against Napoleon).  
Meanwhile, back in the real world, here are the Ponzo Mosaic Updates for SPY and the Qs,  which are looking amazingly bullish given the wall of worry yet to overcome.  I've also plotted the XLF risk forecast since as we all know bull markets are typically led by the Qs and the financials.  The outlook for XLF isn't quite so rosy but this may be in part because we only have 15 years of data to work with while SPY and the Qs have 25 years.


Monday, June 22, 2015

It's All Greek to Me...06.22.15

Despite strong historical precedents for bearish odds this week optimism for a FINAL resolution to the ongoing Greek tragedy let global markets higher and the US markets were happy to follow.  SPY opened at R2 with a NYAD value of 3.93.  Our general rule of thumb (95% reliability past 5 years) is that if the NYAD opens above 3 the odds for a green close are 100%.  (A little fun with numbers there).  SPY did manage to penetrate R3 before falling back in the afternoon session but still managed to close at R2.....that's bullish.  Volume was thin and we still have 4 days in the week to sustain losses but the models are bullish until proven otherwise.  We've seen this Greek bailout fail so many times in the past months that a healthy bit of skepticism is warranted. Here's my friend Dave Moenning's take on the Greeks. Just like Friday we had a nasty little selloff at the closing bar.
Tomorrow we'll look at the weekly Ponzo charts for the SPY and QQQ.

Sunday, June 21, 2015

Bearish Odds for This Week...06.21.15

That was a lousy close on Friday and the technicals are supporting Thursday's note from the Trader's Almanac forecasting a bearish week ahead. Note below that the Ergodics and ADX were divergent all day....another bad omen.  The closing bar on Friday was particularly nasty and the 2 hour chart below shows we have broken through the 8/8 channel am may be looking to retest recent lows. Let's not forget we still have the black comedy of the Greek bailout hanging over our heads and if that situation finally does go down the toilet the markets are likely to react violently and bearish.
The weekly VDX update is a bit ambivalent but looks to be turning down.


Thursday, June 18, 2015

Green for Now, but....06.18.15

A nice broad based rally today with new highs in the NAZ and Russell.  Volume was about 15% above average, the first time we've seen above average volume accompany a rally rather than a decline in over a month.  The ergodics and ADX were in sync all day suggesting actual accumulation and not just HFT arbitrage.  Friday's op ex day's tend to close lower and then there's this note>>>  According to the Stock Trader's Almanac the week after June option triple witching the Dow has been down 14 years in a row and 21 of the last 23 years. The average loss since 1990 has been -1.2%


Wednesday, June 17, 2015

Not Out of the Woods Yet...06.17.15

We were expecting a volatile day based on the FED meeting and the 11 AM blast off was timed to the minute of the FED release.  The surge was rapid and high volume but didn't hold into the close and the divergence of the ergodics and the ADX suggests that a goody portion of that volume was short covering and tomorrow we're likely to see the validity of the hypothesis.  Although M# and LM are now long SPY the 3 day low model is in cash.  We expect Friday, options expiration, to be volatile and close in the red.


Tuesday, June 16, 2015

Forget Greece...Bet on the FED.....06.16.15

Based on today's market action traders have ignored the Greek dilemma and bet on the FED to make them happy on Wednesday.  That may be a fool's bet and today's volume was NOT very enthusiastic but the bulls always get excited when the FED speaks and tomorrow looks like no exception.
We shall see.  Today's ergodics and ADX were in sync all day although the open was jumpy to say the least.  We got a nice BUY entry on the weekly SPY 3 day low model this morning and are still in that position until further notice.
Below note a run of the XLF 10 year study using the 3 day low.  Since these are weekly bars the lows are actually 5 day lows.  The reason I profile XLF (financials) is that financials usually perform exceeding well as the yield curve rises....which is the current milieu.  although other sectors may falter this summer XLF still exhibits strong momentum and relative sector strength. Tomorrow we'll post the actual 3 day low study on daily bars for XLF.


Monday, June 15, 2015

Looks like Last Week + 10 Year Results for 3 Day Low Model....06.15.15

Another Trap Door at the open dropped the SPY to the S3 pivot and it could have gotten really bad from there but the markets rallied (kind of) to finish at a dismal S2.  Selling was once again linked to the breakdown in the Greek negotiations and that's still a black hole of worry for the macro-economic traders. (see daily 3 minute bar chart below)
Also, further on down the page here's what the 3 day low model looks like after 10 years.  These are weekly bars and the model is exactly based on 3 day lows, but something similar ( 5 day lows). The model adjusts positions at Tuesday's open.  What's attractive about this version it that you only trade one a week and the drawdowns are stellar when compared with the raw SPY metrics. The 99% RSQ is the best I've seen yet.  We use a 1.5% limit stop per week, and that also helps the bottom line.


Saturday, June 13, 2015

Trap Door Opens...06.13.15

The dreaded Trap Door, which I had suspected was lurking in the background until Friday, did in fact spring open on Friday ostensibly on breakdown of the Greece bailout program (that's getting to be an old story).  Next Wednesday we have another FED day so volatility will likely spike until then as traders assume proactive and defensive positions against any possibly change in FED policy.  Meanwhile, yields are up, 30 year bonds are falling like a stone and equities are displaying what might be considered a developing head and shoulders patter (see 2 hour chart below).  The SPY VDX looks pretty ugly in terms of risk and is now downslope.  Per the 2 hour chart SPY support in down where we defined it earlier in the week...around 207.50.  Keep in mind June is historically the worst performing month of the year and we're only half way through it.
Regarding the Mosaic models>  the 3 day low model was the winner for the week with a gain of 1%.
 

Thursday, June 11, 2015

What...me worry?....06.11.15

So the markets kind of held together today but it sure wasn't what could be called a strong follow-through day.  Tomorrow will be the test of yesterday's surge and its anybody's guess how that will shake out.  Best idea is to be small.  Our 3 day low model and M3 have reverted to cash while LM is still modestly long the SPY.
Of some concern is the status of the DJ Transports, which have now clearly broken below the 8600 level. While DIA and SPY prices have bounced off the March lows the transports have not followed suit. This is worrisome to say the least in the longer term and highlights the current critical juncture that faces SPY.
 If we do get a Trap Door on Friday or Monday the next leg down could be painful.

Wednesday, June 10, 2015

Will It Hold?...06.10.15

A plus 4 NYAD day pushed the DOW up 236 points.  Just 2 questions>> how much of today's action was short covering and, more importantly, will it hold?.  The top chart is today's 3 minute bars of the SPY's pop above R3 showing that the Ergodics and the ADX were nicely in sync suggesting the HFT programs were in fact providing liquidity rather than trading against it as yesterday's chart indicated.
The lower chart is the 2 hour bar chart of the SPY showing what's happened on 2 previous occasions (yellow arrows) when we've experienced dramatic recovery moves such as today. Also note the similar Ergodic/ADX divergence at the yellow arrow reversals. Just something to keep in mind especially when considering that June is historically the worst performing month of the year and the Friday is coming up fast...so if we,re going to see a Trap Door or something similar then the best odds for such an event are Friday.


Tuesday, June 9, 2015

Looked like a Rally....06.09.15

But SPY ended almost dead on yesterday's close...which was actually below the pivot (see below).
The closing Ergodics/ADX divergence reflects continued market uncertainty.
The bulls just couldn't get the momo going but Wednesday might hold better promise.  We shall see.
The VIX was surprisingly DOWN at the close...which should bode well for the bulls but we've been hoodwinked by the market before so caution is still the watchword.
Going forward we REALLY need to keep in mind the dreaded Trap Door pattern wherein what looks like a one day rally turns into an opportunity for the bears to ramp up selling and swamp the bulls, It's happened before many times so forewarned is forearmed.
We also have the updated SPY PONZO forecast and the skew short term remains bearish.
NYSE announced margin debt is now $500 billion...the last time the markets crashed it was $400 billion, just to give you a sense of  how fragile this market is.


Monday, June 8, 2015

Looking for a Hairy Bottom....06.08.15

Indications are that the current "correction" may not be over yet.  Here's a 2 hour bar chart of SPY looking back to late April and if history repeats itself then 207.30 is the real test of SPY support.
Despite the lousy NYAD readings of late and the dominance of the TICK below the zero line what WE HAVE NOT SEEN is a sustained NYAD reading around 10 or the very low teens and a high volume wash out day.  Those are the parameters that typically set up a "hairy bottom" such as around May 1 and May 7.  Tuesday's are occasionally dubbed "turnaround Tuesdays" due to the historical penchant to be key reversal days.  Such an event may or may not ensue tomorrow.  If such does come to past just be aware that new lows tend to revisit within 30 days.  It's summertime and the momentum is negative.


Friday, June 5, 2015

3 Day Low Studies Show Promise.....06.05.15

Here's a few more examples of the 3 day low system I mentioned yesterday.  One attractive feature of the algorithm is that it just examines a single stock or ETF so you're either in or out.... no relative strength to muddy the waters. Of course, if the market decides to go down 4, 5 or 10 days in a row then this model is going to falter badly like almost any Martingale system.  I'm working on that.
The VIX model is a bit over the top and please note that the limit stop is 3.6%...not .6% as applied to SPY, IWM, XLE and IBM.
Keep in mind VIX can only be traded as options....this is NOT an ETN or ETF.
Ideally I'd come up with a select long /short diversified portfolio and let the algorithm sort through and find potential new Longs.  I'm working on that too.
These are the signals as of Friday's close for Monday........................

Thursday, June 4, 2015

S3 Kind of Day + IWM 3 day low study...06.04.15

Yikes! That was bad. Dow down 170 and VIX up 11.5%.  The Ergodics/ADX were out of sync most of the day and the volume was about 7% above average.  Friday looms tomorrow and the expectations are bearish although we may see some early session recovery based on after hours action today.
Below not a study of the IWM (Russell 200) using the 3 Day Low model posted yesterday.  I'd be lying if I didn't admit frustration with recent LM performance and the 3 day low model is in the running as a possible replacement.  We'll look at a couple other target ETFs on Friday and/or over the weekend but the signals so far have demonstrated some attractive metrics.


Wednesday, June 3, 2015

SPY 3 Day Low Model....06.03.15

As we continue to be whipsawed by the fickle markets here's a study model that has some attractive features including little time in the market, minimal drawdowns and a nice linearity. The model buys the 3 day low in SPY within the constraints of the M3 momentum/ relative strength algorithm.  In order words the M3 modeling creates a momentum model and based on that ranking the 3 day low filter either stands back or signals a trade.  You're only in it for a day or 2 so exposure time is limited and we have a .5% limit stop to further reduce risk.  I'll post the 3 day low model signal henceforth in the daily pre-close update FYI since, like all the other models , based on buying or closing pre-close.

Tuesday, June 2, 2015

Freaky Tuesday...06.03.15

Here's today's 3 minute bar SPY chart.   Now scroll down and look at yesterday's post.  Pretty interesting? Basically we're going nowhere fast...a lot of intradady swing range but with heavy gravitation to the pivot.  We will see some momentum shortly....we just don't know if the break will be up or down.  Based on reader questions tomorrow we'll look at an alternative butterfly setup for the Qs and one for SPY.
Yes..I did not post the SPY VDX chart this weekend, so based on reader feedback, here it is.

We are clearly at BUY threshold levels but the current skew is bearish and the VDI+ slope is negative so there may be a better entry coming as we get closer to the 40% band,

Monday, June 1, 2015

A Tentative Bounce...06.01.15

First trading day of the month and a Monday so we were expecting a bounce.  After a volatile open and considerable stagnation at the pivot we finally got some buying in the afternoon session but over 50% of the bullish momentum evaporated into the last hour and we were left with a NYAD reading of just 1.08 (neutral) and a TICK of -200 (bearish).  We can see the Ergodic/ADX divergence in the last 30 minutes and Tuesday's forecast is not at all clear.  The last hour selloff doesn't bode well.