A huge short covering rally on Friday may see some erosion on Monday.
Traders Almanac lists the last week of January as the most bullish week of the month and then there's the possible end of month rebalance pop so the odds are skewed for the bulls next week.
Our Ponzo and Long Term resistance chart hit the VIX top at 32 perfectly. And, if we put any credence in historical patterns via the Ponzo then we're due for a steady volatility decline for a few weeks....maybe. We just have to update the returns each week to confirm the present outlook.
Saturday, January 23, 2016
Thursday, January 21, 2016
Hey!..Wanta Buy Some Risk????...01.21.16
OK, seriously...DO NOT TRADE THESE SIGNALS. First of all VIX is an index so you can't....you have to trade the options or futures or ETN volatility derivatives like VXX.
That being said...here's the weekly bar chart of the VIX going back a few years and we can see that with yesterday;s pop to 32 the odds are favoring a turn down.
Just to see how that jibed with the M1 Prospector I ran the momentum and mean reversion modes and this is the current mean reversion profile. Note the hefty limit stop.. Not for the faint of heart.
That being said...here's the weekly bar chart of the VIX going back a few years and we can see that with yesterday;s pop to 32 the odds are favoring a turn down.
Just to see how that jibed with the M1 Prospector I ran the momentum and mean reversion modes and this is the current mean reversion profile. Note the hefty limit stop.. Not for the faint of heart.
Wednesday, January 20, 2016
Ponzo Updates for SPY, TLT and the VIX...01.20.16
No hairy bottom this morning as the VIX pops up 11% at the open and the NYAD starts the day at a distinctly bearish .08. There just aren't any buyers. SPY is down >2% and is below the S2 pivot.
This week's Insight has proven to be a welcome treat for TLT players.
Even the resilient XLU has turned down this morning as suggested yesterday.
The new Ponzo updates retain our previous bearish theme bias for the foreseeable future (30 days) as market prognosticators ponder how low we can go.
This week's Insight has proven to be a welcome treat for TLT players.
Even the resilient XLU has turned down this morning as suggested yesterday.
The new Ponzo updates retain our previous bearish theme bias for the foreseeable future (30 days) as market prognosticators ponder how low we can go.
Tuesday, January 19, 2016
Looking for Hairy Bottoms ..01.19.16
Years ago I coined the phrases hairy tops and hairy bottoms to describe candlestick patterns that often accompany trend reversals. The "hair" on a hairy bottom is really the extension tail on the candlestick body and indicates that the close is above the low...the extent of which can be judged by the length of the hair.
While it may be a bit early to bet the farm on the hairy bottom pattern currently setting up it is well worth keeping track of its development as this has proven to be one of the most reliable multiple candle signals.
The screen shot attached is from 40 minutes in on today's market. These are daily bars.
Hairy tops and bottoms are fractal...meaning you can detect them on multiple time frames and day traders of my acquaintance routinely use them on 2 minute bars to gauge waning momentum.
While it may be a bit early to bet the farm on the hairy bottom pattern currently setting up it is well worth keeping track of its development as this has proven to be one of the most reliable multiple candle signals.
The screen shot attached is from 40 minutes in on today's market. These are daily bars.
Hairy tops and bottoms are fractal...meaning you can detect them on multiple time frames and day traders of my acquaintance routinely use them on 2 minute bars to gauge waning momentum.
Saturday, January 16, 2016
VDX Updates and More...01.16.16
After a truly ugly week the buzz is whether we still have more downside to come. It's anybody's guess but the China markets are now below long term support and we have or are about to test the September lows in the major indices.
The one sector that's held up above all others is utilities (XLU) and those readers who have continually wondered why XLU is the default outlier in the M3 index models may now see the attraction of that choice.
Our decision to focus on the possibilities for TLT last week turned out to be precocious and if the slide continues there's still room to run.
The VIX is at long term overhead resistance so the odds are favoring the bulls although how long such a reprieve might last is again anybody's guess.
Earnings season has begun and reports and guidance are likely to be the market drivers for the next month.
The one sector that's held up above all others is utilities (XLU) and those readers who have continually wondered why XLU is the default outlier in the M3 index models may now see the attraction of that choice.
Our decision to focus on the possibilities for TLT last week turned out to be precocious and if the slide continues there's still room to run.
The VIX is at long term overhead resistance so the odds are favoring the bulls although how long such a reprieve might last is again anybody's guess.
Earnings season has begun and reports and guidance are likely to be the market drivers for the next month.
Thursday, January 14, 2016
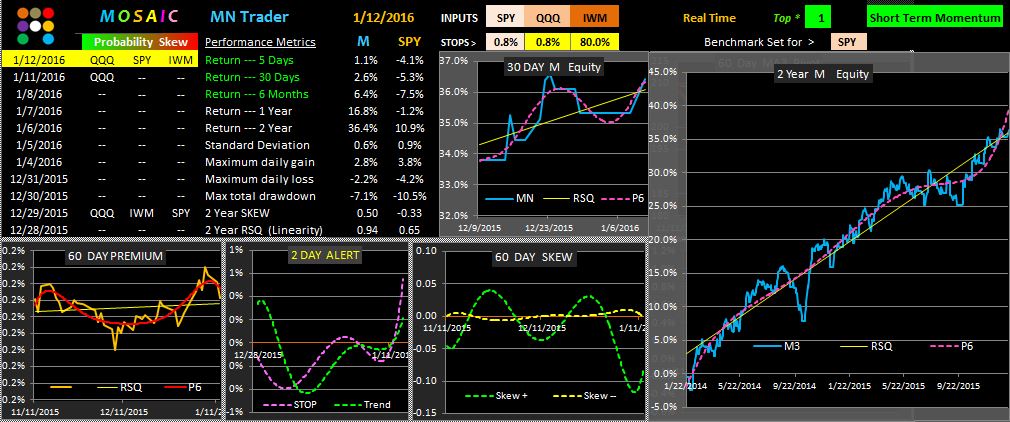
Finding Market Leaders with M3....01.14.16
The indices do not move in sync. There is a constant rotation of strength within the sectors and this is reflected in the ebb and flow of SPY, QQQ and IWM (for example). Since we want to place our trades where the odds for success are highest a simple short term momentum scan of this triad (or any others of your choosing) can frequently deliver a risk/reward result superior to a SPY buy and hold.
Click on picture to enlarge.
Wednesday, January 13, 2016
TLT Mo Ponzo Update...01.13.16
This week's TLT update shows a deteriorating forecast relative to last week.(dotted bar lines) ....similar to what we saw with the SPY chart yesterday but more than a bit odd since we would normally expect a falling SPY to be complemented with a rising TLT (20 year T bonds).
The error percentages are fairly high on these forecast scenarios which in turn leads us to be suspicious of their reliability. The lowest error forecast (orange line) is bullish, as is the best fit line, BUT NOT the consensus average line.
Subscribe to:
Posts (Atom)