The last day of February and one day before the debt ceiling deadline. But no one seems too concerned about it. Somehow these crises have always proved to be only a temporary fly in the ointment in the past and the market response to this issue has been to simply ignore it.
The folks at CNBC think its no big deal, just another little speed bump in the markets rise. It's all about profits and a careful analysis of what otherwise seems like a dismal situation for workers and small businesses turns out to be a win-win for the big banks, big oil and large corporations.
In the meantime, the simple T6 bullish model continues to modestly outperform the SPY.
Note the position of the TrendX SPY in the side panel and the position of the blue equity line vs. the RSQ on the 4 month chart.
These are bullish, until proven otherwise.
Thursday, February 28, 2013
Wednesday, February 27, 2013
AB Update...2.27.13
This is the final posting of the variable AB model...going forward we'll focus on the T6 Lab models, which are much more dynamic, have embedded risk controls, and which can be utilized for either short term or longer term portfolios.
Just for comparison sake here are the AB portfolios in both formats and it's easy to see that the T6 lab offers much more oversight ability and closer scrutiny of the model components. The RM version of AB has failed
to respond effectively to the recent downside whipsaws, thereby producing disappointing short term returns.
I'm watching Bernanke's live testimony this morning and he's optimistic for the energy and financial sectors, so the DOW has just popped (again). All the Spyder sector ETFs are green...with XLE (energy) and XLF (financials) leading the pack. Just a validation of the idea that news really does move the markets.
Just for comparison sake here are the AB portfolios in both formats and it's easy to see that the T6 lab offers much more oversight ability and closer scrutiny of the model components. The RM version of AB has failed
to respond effectively to the recent downside whipsaws, thereby producing disappointing short term returns.
Tuesday, February 26, 2013
T6 Update ...2.26.13
Lesson 2 on how to adjust the vertical axis of any chart was published earlier today.
The T6 bullish model continues to slot XLU as #1 resulting in a very minor improvement over the SPY on short term metrics. All bullish indicators....RSQ/Equity cross, P3 and P6 are negative..a condition that has persisted since 2.19.
I suggested yesterday that we were likely to see extra normal volatility until March 1, and so far that scenario has played out. We had a mini crash in yesterday's last 30 minutes, with a resultant backlash recovery at the open today. This strength does not appear to be holding (on sub normal volume) but caution and cash are attractive to my positioning right now.
We can see how each ETF in the portfolio has performed short term by examining the component metrics and, as suspected, XLU is the current bullish outlier. This is a simple little metrics panel but it delivers a quick snapshot of how each ETF is stacking up. What we don't want to see is a divergence of the short term metrics and the momentum rankings...then we have to be suspect about the momentum slots.
The T6 bullish model continues to slot XLU as #1 resulting in a very minor improvement over the SPY on short term metrics. All bullish indicators....RSQ/Equity cross, P3 and P6 are negative..a condition that has persisted since 2.19.
I suggested yesterday that we were likely to see extra normal volatility until March 1, and so far that scenario has played out. We had a mini crash in yesterday's last 30 minutes, with a resultant backlash recovery at the open today. This strength does not appear to be holding (on sub normal volume) but caution and cash are attractive to my positioning right now.
We can see how each ETF in the portfolio has performed short term by examining the component metrics and, as suspected, XLU is the current bullish outlier. This is a simple little metrics panel but it delivers a quick snapshot of how each ETF is stacking up. What we don't want to see is a divergence of the short term metrics and the momentum rankings...then we have to be suspect about the momentum slots.
T6 Lab Lesson 2
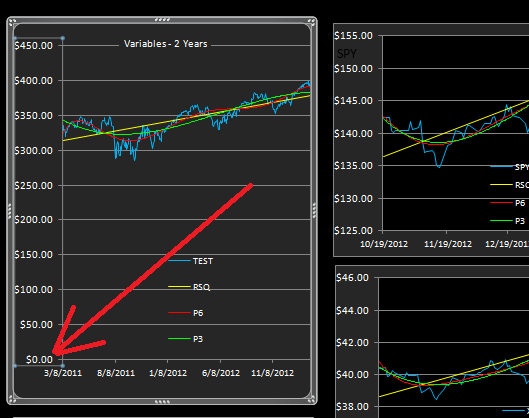
This lesson shows how to reset the vertical axis on any chart on any of the Mosaic files...T2, T6, M6 and M3.
For those familiar with Excel there's no surprises and you likely know the simple procedure already . For others, here's how:
1. Locate a chart you want to modify and click with the right mouse button on the bottom value of the axis.
2. You may have to double click (or tap) to open the menu.
You are then faced with the following panel and "Format Axis" is the option to be clicked on:
3. This will open the formatting menu and for the vertical axis, just deselect "Auto" and check "Fixed". For the chart in question you could select something like 250 to replace the 0.0 value. Then hit the "Close" button at the button of the sheet and the chart will reset. and the control panel will close.
Note: If the axis has dollar values, just enter a whole number..50, 100, 200, etc.
If axis has percentage values, enter decimal values.... .25=25%, .75=75%, 1.00= 100%, etc
If you don't like the resultant look just go through steps 1, 2, 3 again. Or, you can always reset the Axis Options to Auto and let Excel produce its best solution.
After you do this a few times it will seem easy and go much faster.
Just remember to always keep a backup file of the program in reserve in case things go awry.
For those familiar with Excel there's no surprises and you likely know the simple procedure already . For others, here's how:
1. Locate a chart you want to modify and click with the right mouse button on the bottom value of the axis.
You are then faced with the following panel and "Format Axis" is the option to be clicked on:
3. This will open the formatting menu and for the vertical axis, just deselect "Auto" and check "Fixed". For the chart in question you could select something like 250 to replace the 0.0 value. Then hit the "Close" button at the button of the sheet and the chart will reset. and the control panel will close.
Note: If the axis has dollar values, just enter a whole number..50, 100, 200, etc.
If axis has percentage values, enter decimal values.... .25=25%, .75=75%, 1.00= 100%, etc
If you don't like the resultant look just go through steps 1, 2, 3 again. Or, you can always reset the Axis Options to Auto and let Excel produce its best solution.
After you do this a few times it will seem easy and go much faster.
Just remember to always keep a backup file of the program in reserve in case things go awry.
Monday, February 25, 2013
T6 Lab Lesson 1
The T6 Lab charts provide 2 different ways of deconstructing a portfolio.
There are grey background charts and black background charts.
Only the black charts are linked to the metrics fields.
The 2 "Variables" charts with the grey chart fields are linked to the Variables position sizing matrix with the position sizing indicated by the yellow numerals. You can adjust these numbers (do not adjust the percentage values..they will recalculate automatically) to quickly see how different portfolio mixes affect both the 4 month and 2 year charts. These 2 charts are not linked to the Performance metrics and those values will not change if you adjust Variable sizes.
All the other black background charts, including the Flux chart, are linked together and reflect an equal weighting of the portfolio defined in the TICKERS list. If you wanted to see the results of the portfolio with a zero position in QQQ, you can accomplish this by simply going to the Data tab and removing QQQ from the Ticker list.
Please note...If you do remove a component from the Ticker list you must fill in that space by moving a lower component into that space. The Lab will not calculate if there is a gap in the Data tab Ticker list.
There are grey background charts and black background charts.
Only the black charts are linked to the metrics fields.
The 2 "Variables" charts with the grey chart fields are linked to the Variables position sizing matrix with the position sizing indicated by the yellow numerals. You can adjust these numbers (do not adjust the percentage values..they will recalculate automatically) to quickly see how different portfolio mixes affect both the 4 month and 2 year charts. These 2 charts are not linked to the Performance metrics and those values will not change if you adjust Variable sizes.
All the other black background charts, including the Flux chart, are linked together and reflect an equal weighting of the portfolio defined in the TICKERS list. If you wanted to see the results of the portfolio with a zero position in QQQ, you can accomplish this by simply going to the Data tab and removing QQQ from the Ticker list.
Please note...If you do remove a component from the Ticker list you must fill in that space by moving a lower component into that space. The Lab will not calculate if there is a gap in the Data tab Ticker list.
T6 Update ..2.25.13
We're seeing a moderate volume downdraft this morning after an opening gap up. If a debt ceiling resolution is forthcoming a couple hundred point surge is likely but no one at this point is very hopeful for such an event.
Nevertheless, there will be rumors and leaked reports along the way so we can expect some volatility before the dismal deadline is crossed.
GLD and TLT are the beneficiaries of today's weakness but that scenario could reverse quickly.
The T6 version 3 was sent to all users this weekend. If you didn't receive it send me an email at etfmosaic@aol.com and I'll get it off.
It been interesting to see XLU (utilities) jump into #1 slot for the past three days. XLU is typically seen as a market neutral index and its momentum reflects concern about the continuing viability of the equities.
For the default portfolio of the T6 version 3 Lab I've replaced IWM with QQQ, but you can run it anyway you please. The Qs haven't done very well lately as evidenced by the #6 slot for the entire lookback period.
Keep in mind that this is a bullish portfolio with little risk hedge other than XLU. Going forward we'll look at a bear T6 Lab portfolio so that when you look at both of them side by side it's easier to detect underlying market momentum.
Later today I'll post Lesson #1 for the T6 Lab features.
These lessons will be issued as separate posts with the intent of making them easier to archive and retrieve.
Nevertheless, there will be rumors and leaked reports along the way so we can expect some volatility before the dismal deadline is crossed.
GLD and TLT are the beneficiaries of today's weakness but that scenario could reverse quickly.
The T6 version 3 was sent to all users this weekend. If you didn't receive it send me an email at etfmosaic@aol.com and I'll get it off.
It been interesting to see XLU (utilities) jump into #1 slot for the past three days. XLU is typically seen as a market neutral index and its momentum reflects concern about the continuing viability of the equities.
For the default portfolio of the T6 version 3 Lab I've replaced IWM with QQQ, but you can run it anyway you please. The Qs haven't done very well lately as evidenced by the #6 slot for the entire lookback period.
Keep in mind that this is a bullish portfolio with little risk hedge other than XLU. Going forward we'll look at a bear T6 Lab portfolio so that when you look at both of them side by side it's easier to detect underlying market momentum.
Later today I'll post Lesson #1 for the T6 Lab features.
These lessons will be issued as separate posts with the intent of making them easier to archive and retrieve.
Friday, February 22, 2013
VTV followup & P6....2.22.13
This is a followup to yesterday's VTV post and, as expected, XIV took a hit on market weakness which is now reflected in the short term metrics.
The issue that is worth pointing out is the effectiveness of the P6 slope in seeing this weakness coming...both in XIV and SPY (and IWM as mentioned since last Friday). At the same time we've seen the P6 go upslope on AGG which is typically bearish for equity markets. Had the P6 slope guidelines been followed regarding XIV and SPY, any monies in those positions should have been closed by the 19th end of day, thereby avoiding the downdraft over the past 2 days. These risk management tools actually do work,,,the trick is in paying attention to their reversals and reacting accordingly.
Subscribe to:
Posts (Atom)