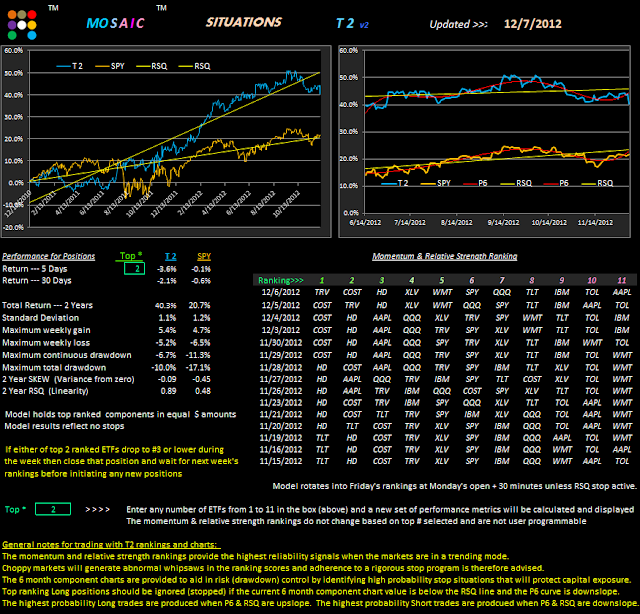
This, of course, is the main panel from the T2 software that subscribers will be receiving this weekend (Sunday). I'll add an option #8 button to the main Mosaic site later today for the VTV program. Within a week or so, VTV will be issued as 2 programs...an analytical version mirroring the file below and one tracking the performance metrics. For now, subscribers will receive the analytical version.
Just for curiosity sake I entered a few high flying stocks into the T2 mix (above) to see how they have performed relative to my default portfolio. This model in particular highlights how valuable the RSQ and P6 stops can be in preserving capital.
With the T2 software in hand you can experiment endlessly with model portfolios of this type and you don't have to just look at the performance of the top 2...you can examine the top 1-11 performance with the click of the green box #. You also don't have to enter 11 stocks or ETFs...you can enter any number up to 11. I'm looking forward to hearing from readers on portfolios they have created that test out particularly well.
Below is the current VTV view of momentum. The fact that the SPY and XIV RSQ slopes do not match and the TLT and VXX RSQ slopes do not match illustrates the high degree of uncertainty in the markets...even as the VIX continues to hover around the 16 level. These conditions typically presage a major market move...which way is the $64 question.


