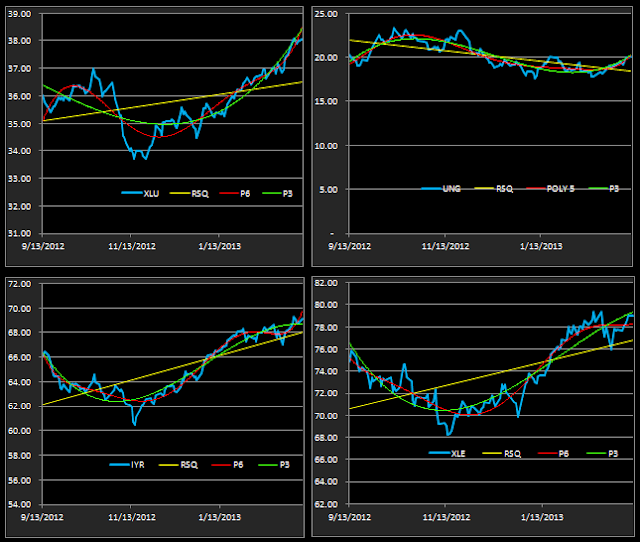
Just checking in on the T2 Commodities model and ...surprise!...UNG is still leading the pack in momentum ranking. Taking an under the cover look at the data actually shows UNG has been #1 since Feb 26th...quite a run.
Last week I suggested it might be time to scale back on any UNG positions due to the down slope character of the RSQ on the 6 month UNG chart. That's still the situation as of today's update.
The results below reflect a top 2 sort.
The top 1 sort is a barn burning, with considerably more risk, of course.
Thursday, March 28, 2013
Wednesday, March 27, 2013
Modified X file for T2..3.27.13
This is a little different version of the X file...using the X.. ETFs of the Spyder Sectors. In lieu of SH (SPY inverse) to round out our 11 components I've substituted XRT, the Spyder retail ETF.
XRT is not one of formal Spyder Sector ETFs, but is the Spyder S&P retail ETF, so it reflects a broad base, has good daily volume,and provides a somewhat different momentum pattern than either XLY or XLP.
It's actually been making a solid contribution to the revised T2 X file lately as XLU (the safety net ETF has migrated off #1 ranking in the past few days.
So what we've done here is take the S&P and break it down into 10 component parts and then just focused capital on those sectors that were outperforming.
Tuesday, March 26, 2013
T2 AB Model...3.26.13
Yesterday I mentioned the opening fade trade and today was another picture perfect example, especially when viewed using the NYAD indicator. I also received some questions regarding high frequency trading, order flow masking, etc.
Here's a link back to a series of posts I did back in 2007 (seems like yesterday) that puts the matter in better perspective...if you've got the time and inclination to pursue the matter.
For today's model view, here's an update to the AB portfolio developed earlier this year to mimic the market neutral approach of the now retired LM model.
As with all portfolios our main focus is capital preservation and drawdown minimization.
Our credo is to never get too cocky with trending returns...the markets do change and when they do the change can be dramatic. Always follow the risk control tools including RSQ and P6 to evaluate any new positions...you will seldom regret it.
Monday, March 25, 2013
Recent NYAD Action...3.25.13
I've mentioned the NYAD before (NYSE advance/decline line) as one of the most reliable short term market momentum indicators. The high frequency trading algorithms that account for over 80% of typical daily trading volume can't manipulate this number like they can with the TICK and the TIME & SALES numbers. It's one of the few windows of transparency that are still available to the retail trader focused on short term trading and most data platforms symbolize it as $NYAD, or NYAD.X, or similar. It's definitely worth tracking if you are a short term trader.
The reason I profile the NYAD here is that its recent action illustrates why I recommend NOT trading the open of the market session to put on new trades, but instead waiting at least 30 minutes.
Now, selling a long position into the open is an entirely different story and, it should be pretty clear that opening gaps to the upside have been routinely knocked down during the first 30-60 minutes, so this is a good time to close Long positions.
The charts shown below are in Schwab Street Smart Pro platform format:
The above chart is 2 minute bars showing today's open in detail.
It also displays an overlay line chart of the VIX (volatility index) and a parabolic indicator (white dots).
The chart below is a 14 day chart on 65 minute bars showing the consistency of the morning fade pattern. Why 65 minute bars? The trading day is 6.5 hours = 390 minutes/6 bars = 65 minutes. Many technical traders use hourly bars (60 minutes) but I have found that a 65 minute chart delivers considerably improved results for short term trading as it divides the trading day into 6 equal parts not 6 1/2 parts.
Friday, March 22, 2013
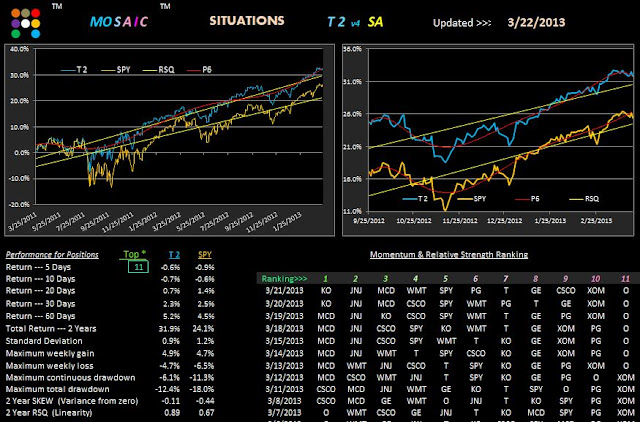
T2 Seeking Alpha Update..3.22.13
Today we check in on the Seeking Alpha portfolio mentioned several times in previous posts. This is a portfolio of stocks, not ETFs so we should expect greater volatility than the T2 default model.
In fact, a top 2 sort of the portfolio actually reveals a better RSQ than SPY and a better drawdown profile.
Conclusion...the Seeking Alpha team has made some good picks longer term although short term the model has faltered when we only consider the top 2.
Another view using a top 11 sort...all in...shows returns more consistent with the SPY benchmark, and still displaying improved RSQ and lower drawdown.
Thursday, March 21, 2013
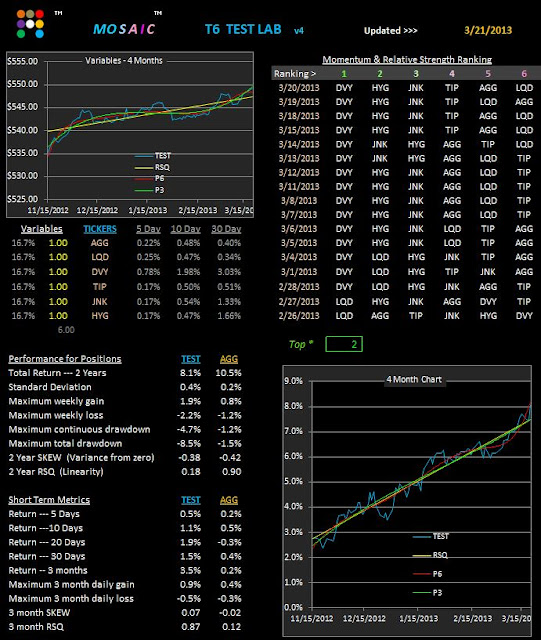
T6 Bearish model Update...3.21.13
Checking the T6 neutral/bearish model shows DVY (the DOW dividend linked ETF) as the #1 ranked for most of our lookback. That may be about to change.
The real test of the equity markets will be when (and if) TIP and AGG slide closer to #1 slot. The high grade corporate and junk bond ETFs (HYG and JNK) have been riding the mid ranks....positions to be expected in a basically trending market. As trends stall or reverse we are likely to see these mid ranking persist while the #1,2,5 and 6 outliers switch positions. If the #3 and 4 slots also migrate to one extreme or the other of the rankings we may expect that a much more fundamental change is occurring or likely to occur soon.
Just something else to keep an eye on.
Wednesday, March 20, 2013
T2 Commodity model on fire...3.20.13
For those who found the commodity based T2 model attractive the results have been pretty impressive.
The short term returns have been a product of continued UNG gains but a quick look at the component charts shows good momentum in XLU as well...so a top 2 sort also produces nice returns.
By avoiding the equity/bond skew using commodities we have also avoided the relative consolidation of the markets during the past 30 days. Whether UNG can sustain its current run remains to be seen but the down slope RSQ in the 6 month chart (not shown) argues for an upcoming reversion back to that line.
Tuesday, March 19, 2013
T6 Toppy..3.19.13
Checking in on the T6 (top 2 version) bullish model finds our equity line below the RSQ stop line but upslope on the P6. Surprisingly, the slower P3 line is flat and looking to go either way. SPY and IWM have moved out of range of the #1 ranking with XLF looking to pop in and out of the #1 slot.
The current divergence in the rankings of XLF and QQQ is at odds with our underlying premise that tech and financials will typically lead the markets above resistance levels to new highs.
For now the RSQ for all 6 components is upslope, as is the P6, but we are also seeing evidence in all 6 components that the equity curve is weakening.
As mentioned yesterday...watch the SPY TrendX in the right side panel for an real time view of momentum.
Monday, March 18, 2013
T2 Default Update..3.18.13
Looking at the T2 default model reveals the continuing leadership of IWM and XLV, a pair that was identified as likely market gainers following the Obama re-election. The IWM has been a real workhorse in our default model ever since and the component charts in your software show both the RSQ and P6 solidly bullish at the current time.
Note the position of the SPY TrendX in the right side panel. Keep in mind that the TrendX tracks the moving daily pivot of the SPY (and TLT below) which = (High+Low+Close/3) and gives a much better reflection of underlying strength or weakness in price versus simply looking at the closing price.
I managed to mess up my neck this weekend which has limited my time at the computer and my ability to send out the T6 Weekly Lab as promised. It will be sent out later today with the weekly update calculated after 7 PM tonight PST.
Friday, March 15, 2013
T6 Weekly..3.15.13
Its the Ides of March and here's a abbreviated weekly version of T6 developed for subscriber with a longer term trading preference . There's not a lot of metrics presented since the weekly frequency makes them poor portfolio guidance tools. The model does contain the usual 6 month component look back charts with RSQ and P6 overlays which can be used for a risk management assessment of the momentum model. Note the continuing weakness of the bond sector. The software will be sent out this weekend to all users as part of the Mosaic toolbox.
Since this model trades weekly bars in lieu of daily bars the momentum algorithm is much faster than the standard T6. As a result, if you run this same portfolio on the standard T6 platform a different set of performance results will be generated.
Since this model trades weekly bars in lieu of daily bars the momentum algorithm is much faster than the standard T6. As a result, if you run this same portfolio on the standard T6 platform a different set of performance results will be generated.
Thursday, March 14, 2013
T2 FX portfolio..3 Views...3.14.13
As promised yesterday, here are 3 view of the FX portfolio....one with the full mix including the commodity outliers, one with the commodity outliers removed and the final with SPY removed. Based on these three views of a top 2 sort we can see the tradeoff in risk/reward by using the fuller model...we clearly get bigger returns with the more robust model, but incur more volatility along the way. On the shorter term time frames the pure currency model is a bad choice and shows little evidence of the trending behavior the T2 model likes to capture. Although the US dollar double (UUP) has been leading the pack for some time the percentage change in this low beta instrument make it a difficult way to beat, or even keep up, with the SPY.
That's why I suggest using the fuller FX model with the commodity based currency outliers and SPY as active components.
If you want to pursue this idea further one avenue of opportunity is a top 1 sort of the last FX model posted here yielding 10% over 2 years but surprising robust over the past 30 and 60 days.
Wednesday, March 13, 2013
T2 FX...3.13.13
Keeping in mind the risk management benefits or maintaining several diversified portfolios of non-correlated financial instruments, here's an update of the FX (foreign exchange, currency portfolio) previously discussed.
The outliers of GLD, SLV, XLE and SPY within the portfolio provide multiple active currency related benchmarks to help determine the relative momentum of the FX components versus commodities related financial instruments (GLD, SLV, XLE).
Given the inherent low beta of the pure FX ETFs we should expect lower returns and lower drawdowns with the entire portfolio relative to the SPY (with a top 2 sort) which is what we are seeing in the shorter time frames.
A fuller understanding of this model's dynamics, and the inherent risk factors, will be the subject of tomorrow's post
Tuesday, March 12, 2013
T2 Commodities..3.12.13
Monday, March 11, 2013
VTV View of Volatility...3.11.13
For subscribers who don't have the short term VTV software here's the current view showing how volatility has NOT fallen relative to the recent SPY gains. As of this morning's open the VIX stands at 12.17, slightly ahead of the 2/19 low of 12.09. For technical chart readers this looks a lot like a "double bottom" or W pattern, which is usually accompanied by a rise in the instrument (VIX). There are a number of factors that may keep us locked at this level for a bit longer but we are currently at a critical juncture.
The XIV (inverse VIX proxy) has been spinning its wheels for a while as reflected in its current ranking and most of the short terms gains from the top 2 approach have not been due to volatility declines.
In fact, the instability in the #1 ranked slot has produced sub par returns short term if positions had been held for the duration without exercising the P6 slope risk management stop on VTV (downslope P6 = cash, upslope P6 = vested).
The big FED buying days this week are Thursday and Friday and Friday is monthly options expiration so we may expect some bullishness and volatility.
I did expand my study of FED trading and posted the results on the Prophet site if this setup interests you..
Friday, March 8, 2013
T2 Chart Check...3.8.13
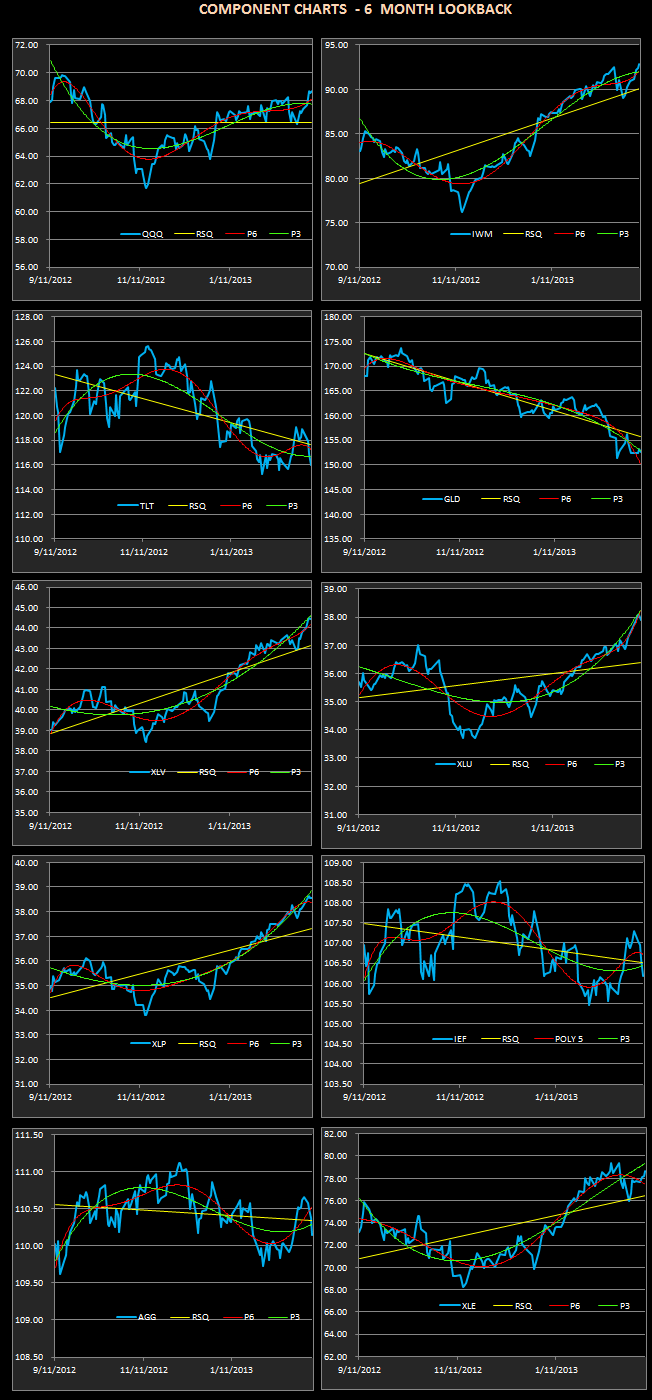
Looking at the component charts of the T2 default model, which contains both equity and bond based issues its clear that the bulls are still in charge. The lowest 4 ranks are all bonds and gold...that's as bullish as it gets. The charts also reveal the XLU continuing surge while QQQ looks surprisingly neutral with a flat RSQ.
From this view IWM is the much better bet than QQQ but that could change if Apple gets something going.
Bonds, especially TLT, are getting het hard so our decision to back out of Treasuries was a good one in hindsight.
From this view IWM is the much better bet than QQQ but that could change if Apple gets something going.
Bonds, especially TLT, are getting het hard so our decision to back out of Treasuries was a good one in hindsight.
Thursday, March 7, 2013
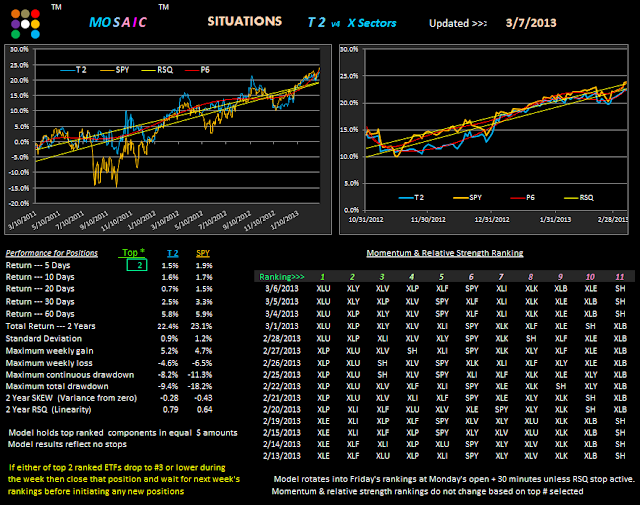
T2 X Sectors...3.7.13
This is the current view of the Sypder Sector T2 portfolio (X file). XLY (consumer discretionaries) is fighting its way towards #1 slot and in faster momentum versions of T2 its already there. It doesn't appear that there's a lot to be gained relative to SPY using this approach...other than considerably reduced volatility and a reduced drawdown. If that's important to your peace of mind then its worth the the extra work.
Short term traders: I hope you paid attention to yesterdays FED schedule post and the hint about buying the close of the day before the bigger buying days. It worked out well today and we'll track it for the rest of the month just to build a bigger data base..
Short term traders: I hope you paid attention to yesterdays FED schedule post and the hint about buying the close of the day before the bigger buying days. It worked out well today and we'll track it for the rest of the month just to build a bigger data base..
Wednesday, March 6, 2013
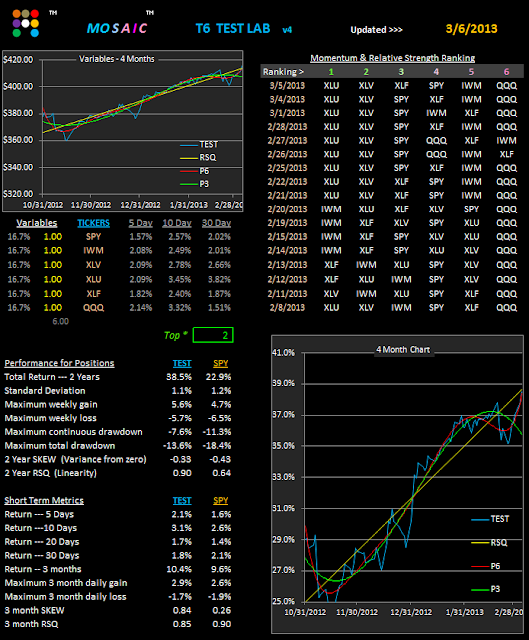
T6 Variation...3.6.13
Monday we looked at 2 different portfolios, one with QQQ and one with IWM. Here's another variation using both QQQ and IWM, but this time time deleting XLE (Oil) from the mix. The results may be a bit surprising since XLE was ranked #1 for extended periods during our 2 year lookback in the previous models. Turns out the real issue is volatility, as demonstrated in the resultant metrics in this model without XLE.
Hope you enjoyed that video yesterday. At least they could have adjusted the seat for the kid but I guess in 10 years it will be just the right height for him.
Here's another link, much more mundane. It's the FED's POMO schedule. Shorter term traders are well advised to keep track of the days with big buying...it does make a difference in market dynamics. The schedule automatically updates every month so you can see the potential impact well ahead of time. I ran some studies last year that showed an overnight edge by buying at the close the day before the big days and then selling mid day on the actual buy days. Just something to keep an eye on if the idea intrigues you.
Tuesday, March 5, 2013
T2 Update...3.5.13
Checking in on the default T2 portfolio reveals much the same momentum as the T6 LAB, only when viewed over a larger sector field. GLD remains the worst performer with limited prospects going forward. This situation may persist for some time unless some news driven events derail the current market momentum.
IWM and QQQ should start migrating to higher rankings if the bull run is to continue, otherwise XLU may hold onto #1 even though today's action reflects a 4 year high in that ETF.
Finally, here is why Chinese sheetrock is so cheap. You'll have to endure the 10 second intro (in Chinese), but I guarantee you'll never think the same about Chinese business after you watch this video.
Monday, March 4, 2013
T6 Lab...QQQ vs IWM...3.4.13
This study looks at the T6 bullish portfolio with all positions the same except QQQ vs. IWM.
Following Obama's re-election the decision was made to make IWM a T6 bullish component based on a variety of technical and fundamental research that argued for likely out performance of the IWM and XLV sectors.
At the same time most bull markets are exemplified by the co-leadership of QQQ and XLF so we want to be positioned to capture these gains if that paradigm materializes this year.
Here's a look at how the 2 variations of the bull model have performed so far:
First with IWM..above...then with QQQ.. below:
We are using a top 2 sort for our study...If you run a top 1 study you will notice an improved consistency with the IWM model.
Meanwhile XLU continues to rank #1 in both models.
Friday, March 1, 2013
T2 Commodities Update ...3.1.13
Checking in on the T2 commodities portfolio reveals oil and gas with the biggest momentum, with a temporary detour to XLU for a few days while the markets consolidated. These results support the previously noted expectancy for energy and financials and, if you look at the individual UNG, XLE and XLU charts on your software the trends are all bullish for now.
The commodities portfolio does produce greater volatility than the benchmark SPY, so attention to risk management stops becomes doubly important in order to avoid substantial give back of accumulated gains.
The commodities portfolio does produce greater volatility than the benchmark SPY, so attention to risk management stops becomes doubly important in order to avoid substantial give back of accumulated gains.
Subscribe to:
Comments (Atom)


