The model remains in a stopped mode.
Note that the T2 2 year return has suddenly dropped several % from the previous post while the 5 day returns have basically been flat. Why is that? Because the 2 year metric is based on a floating 504 day lookback period. That means that each daily update looks at a performance period that has an incremental new starting point and ending point (Now).
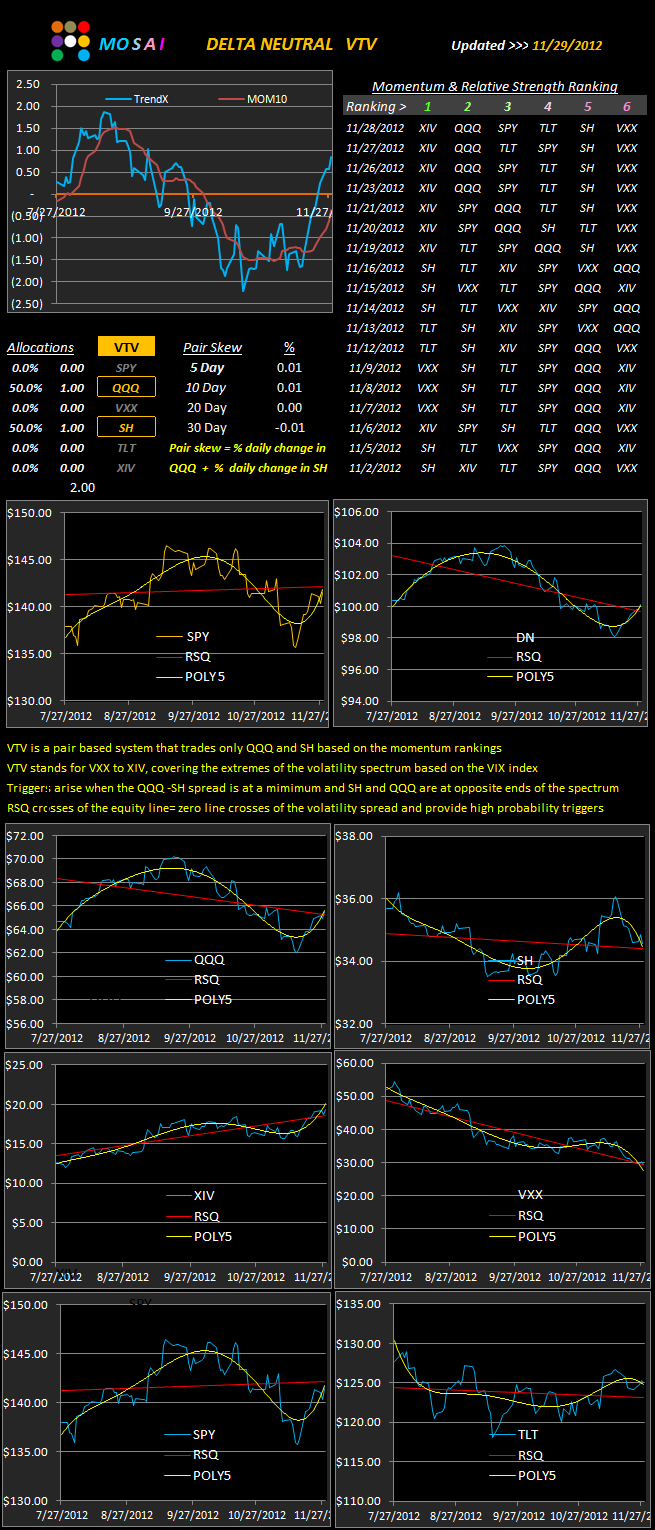
Here's the VTV update:
VTV is a companion program to T2 but uses a different logic and tactics.
This little stand alone program uses a faster ranking algorithm than T2 and only looks at the volatility spectrum using QQQ and SH as trading instruments. The same STOP controls (RSQ and POLY5) are now shown in the lower chart panels. Basically we waant to be Long the upsloping POLY5 and in cash for the downslope POLY5. The red RSQ line is a "line in the sand" confirmation signal of the short term trend.
Currently, 5 of the 6 components are at the RSQ line.
The component charts are aligned horizontally as inverse pairs: QQQ vs. SH, XIV vs. VXX, SPY vs. TLT to get a better picture of the consensus signal.


