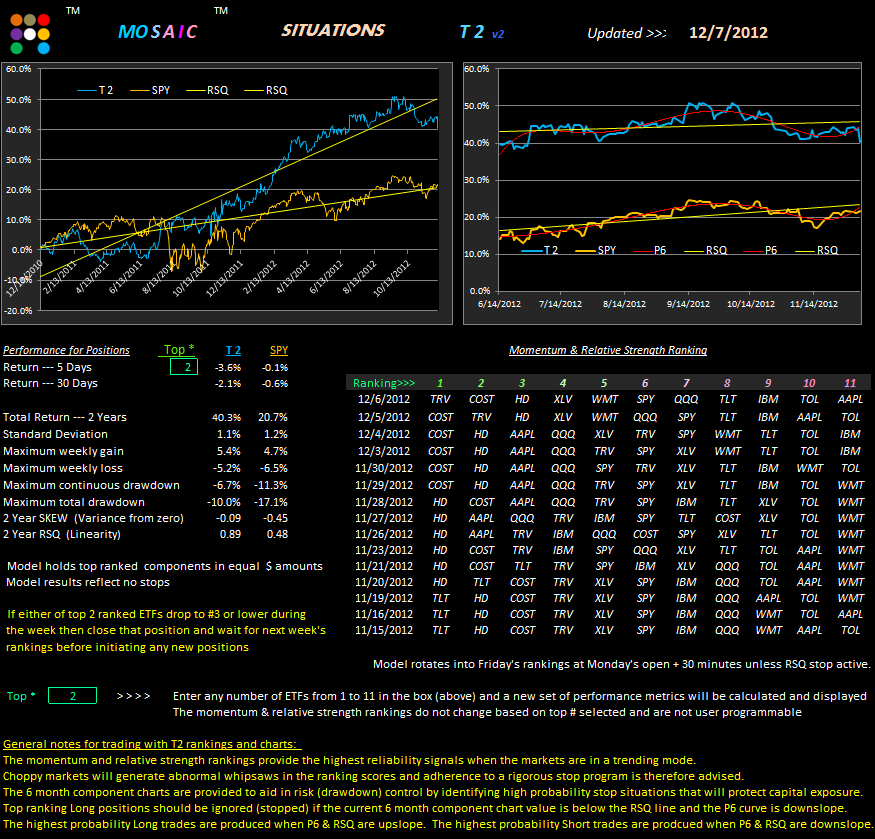
This, of course, is the main panel from the T2 software that subscribers will be receiving this weekend (Sunday). I'll add an option #8 button to the main Mosaic site later today for the VTV program. Within a week or so, VTV will be issued as 2 programs...an analytical version mirroring the file below and one tracking the performance metrics. For now, subscribers will receive the analytical version.
Just for curiosity sake I entered a few high flying stocks into the T2 mix (above) to see how they have performed relative to my default portfolio. This model in particular highlights how valuable the RSQ and P6 stops can be in preserving capital.
With the T2 software in hand you can experiment endlessly with model portfolios of this type and you don't have to just look at the performance of the top 2...you can examine the top 1-11 performance with the click of the green box #. You also don't have to enter 11 stocks or ETFs...you can enter any number up to 11. I'm looking forward to hearing from readers on portfolios they have created that test out particularly well.
Below is the current VTV view of momentum. The fact that the SPY and XIV RSQ slopes do not match and the TLT and VXX RSQ slopes do not match illustrates the high degree of uncertainty in the markets...even as the VIX continues to hover around the 16 level. These conditions typically presage a major market move...which way is the $64 question.
Friday, December 7, 2012
Thursday, December 6, 2012
T2 Update + Charts...12.6.12
No new Alerts today. Actually, several of the alerts went short at yesterday's close so it will take at least a couple days to work off those signals. Apple really took a bite out of the Qs yesterday and we're seeing some recovery today. The financials led the charge yesterday although 28 out of 30 DOW stocks were green almost all day long on about 70% normal volume.
Reflecting ongoing market uncertainty both TLT and QQQ are green today, while XIV, the hyper signal of bullishness, is alternating between flat and red. A lot can happen the rest of the day but for now we remain in a stopped mode as our momentum leaders show signs of stalling on the charts while the bond ETFs are looking stronger.
Wednesday, December 5, 2012
VTV Tickler & TAQK, LM Updates...12.5.12
From the Mosaic Testing Lab here's some performance data on the VTV concept (this version only trades on a weekly basis) looking back 7 years. Keep in mind XIV has only existed since 2011 and VXX has only existed since 2009 so the long term results are a bit skewed to the QQQ/SH extremes of the spectrum but the recent 2 year results are more an indication of likely outcomes of a true XIV/VXX spread. VTV is intended to trade only QQQ and SH so additional deconstruction of the momentum rankings will be required in the Lab to generate more realistic expectations. In this version the model holds the top 2 positions. Volatility increases substantially if we just hold the top 1 position.
As of 30 minutes in today (12.5.12) these are the weekly updates of TAQK and LM with the TAQK model revealing the weakness in GLD (gold) that is holding the LM model back...note the #6 ranking of GLD in the LM model.
TAQK is now in an Hold mode...Updated 8:00 am PST. It opened in an accumulate mode but has now reverted to a HOLD status based on QQQ and XLK weakness.
For our own portfolios the position allocations were rebalanced at the close on Friday and the next rebalance is scheduled for 12.28.12.
As of 30 minutes in today (12.5.12) these are the weekly updates of TAQK and LM with the TAQK model revealing the weakness in GLD (gold) that is holding the LM model back...note the #6 ranking of GLD in the LM model.
TAQK is now in an Hold mode...Updated 8:00 am PST. It opened in an accumulate mode but has now reverted to a HOLD status based on QQQ and XLK weakness.
For our own portfolios the position allocations were rebalanced at the close on Friday and the next rebalance is scheduled for 12.28.12.
Tuesday, December 4, 2012
Software + Subscription Changes...emailed on 12.5.12
Just a heads up... the T2 and VTV software offering will be emailed to each subscriber on 12.5.12, along with the changes to the Newsletter format and your new subscription options.
Please respond back by December 15th with your choice.
Please be aware: T2 and VTV are in EXCEL format and you must have EXCEL 2007 or newer installed on your computer to run the software. In addition, you may be asked to "enable all macros" at startup and this is just a simple click of the permission button to activate.
Please respond back by December 15th with your choice.
Please be aware: T2 and VTV are in EXCEL format and you must have EXCEL 2007 or newer installed on your computer to run the software. In addition, you may be asked to "enable all macros" at startup and this is just a simple click of the permission button to activate.
T2 Update 12.4.12
Tuesday's update continues with a stopped mode and no new Alerts. Considering that T2 is a momentum driven model it follows that trending markets provide the best opportunity for capital appreciation...a situation we have not seen for several months, although there has been a downtrend tendency in the background. We continue to experience anemic volume in the majors and momentum changes on a day to day basis, reflecting a high level of uncertainty in the markets. The fact that the VIX continues to stabilize at the 16 level does reveal an underlying bullishness but as we inch closer to the January fiscal cliff deadline that may increase.
The component charts are shown below to help give some clarity to the issues at hand.
Note that Poly 5 has been updated to P6 ..the 6th degree version...which accelerates the momentum change indicator line by about 7%.
.
The component charts are shown below to help give some clarity to the issues at hand.
Note that Poly 5 has been updated to P6 ..the 6th degree version...which accelerates the momentum change indicator line by about 7%.
.
Monday, December 3, 2012
Big Changes Ahead...T2 and VTV Software Package
As we approach release of the T2 and VTV software here's a synopsis of what's included and what's not in the 2 programs.
Over the next day or 2 each subscriber will receive an email detailing ongoing subscription and software options. Since readers have started subscriptions at various times over the past year each case is calculated somewhat differently and that will be reflected in the pricing.
Subscription and software options:
1. Continue with subscription for duration of 1year term = $150 (you will receive a pro-rated credit based on the initial $250 fee) .
2. Cancel subscription and receive pro-rated rebate based on expired % of 1 year term @ $250.
3. Purchase T2 software= $ 100.
4. Purchase VTV software= $ 75
5. Purchase T2 and VTV= $ 150.
This pricing is for current subscribers only.
Going forward within the next 10 days the Newsletter format will change to approximately 3 times a week, focusing more on research ideas using the T2 and VTV software (and the LM and TAQK models). Adopting this new format and giving users the opportunity to explore T2 and VTV scenarios of their own design should allow users to gain better control of their investment options while at the same time reducing the wait time for me to update the files and examine the current momentum rankings and RSQ/P6 values.
Each program (T2 and VTV) has 2 tabs...a Data tab where data inputs are loaded and a Results tab where either the T2 or VTV results are tabulated. The Ticker inputs for both programs can be either ETFs or NYSE/NASDAQ stocks and you can load up to 11 inputs in the T2 model and 6 inputs in the VTV model. Using the T2 model the user can mimic the T6, T9, Lazy Man or any other variations of the T2 strategy. You can select results for top 1,2,3,4,5, etc models without refreshing the Data update. The momentum rankings are calculated automatically in conjunction with the Data update.
Depending on the chip set spreed of your particular computer the processing time for Results once Data inputs are entered is approximately 15 seconds.
The DB, MRSI and GS2 Alerts are not part of the T2 program since they are generated through TradeStation and there is no functional link between the two programs. The side panel charts of the components with the RSQ and P6 (updated polynomial 5th degree to 6th degree function) indicators are intended to provide a baseline for creating your own risk control STOP policy.
T2...
Allows the user to use default portfolio or enter up to any 11 ETFs or NYSE/NASDAQ stocks. Smaller component portfolios such as the 6 ETF Lazy Man or other models having less than 11 components can be created and analyzed by simply entering only the number of components desired
Provides end of day historical data returns
Includes the same metrics panel as recent newsletter posts
Includes comparative charts of the benchmark and the composite T2 model for 2 years and 6 months
Includes 10 component charts to help analyze price behavior of each component stock or ETF and to gauge appropriate risk control stops based on RSQ and/or P6 (6th degree polynomial) values
What's not included:
Alerts based on DB, MRSI and GS2 TradeStation studies
Automatic stop signals
VTV...
VTV is designed to help identify trading opportunities in QQQ and SH by analyzing the behavior of volatility related ETF/ETNs XIV and VXX as well as the high statistical inverse correlation of QQQ/SH and SPY/TLT. VTV displays a historical spectrum of the volatility skew as a means to gauge the probability of such trades. Different target pairs and benchmarks can be entered by the user. VTV uses a momentum algorithm that is faster than the T2 model in respect for the high beta values of XIV and VXX.
Allows the user to use default portfolio or enter up to any 6 ETFs or NYSE/NASDAQ stocks. Smaller component portfolios such as the 6 ETF Lazy Man or other models having less than 6 components can be created and analyzed by simply entering only the number of components desired
Provides end of day historical data returns
Includes the same metrics panel as recent newsletter posts
Includes comparative charts of the benchmark and the composite VTV model for 6 months in both close up and macro views
Includes 6 component charts to help analyze price behavior of each component stock or ETF and to gauge appropriate risk control stops based on RSQ and/or P6 (6th degree polynomial) values
What's not included:
Automatic stop signals
Metrics performance reporting panel.
(Sample performance metrics will be posted over the next few weeks to illustrate the types of returns that can be achieved using the model rankings.)
In the near future we also plan to offer the z-score based Pairs trading software so that users can further evaluate trading opportunities in any inversely or positively correlated pair of ETFs orNYSE/NASDAQ stocks .eg. QQQ vs SH, SPY vs. IWM, LOW vs. HD, etc. etc.
I'm also working on a lite version of the LM and TAQK variable allocation models that will distributed to holders of T2 and VTV. The current issue is that the program contains proprietary add-ins that I cannot redistribute gratis. In any event, the LM and TAQK (and other versions) will still be posted on a weekly basis. Since LM and TAQK are intended to be long term investment models and not trading instruments such periodic updates should not compromise the model results. Changes to RM status-- either Vested or Cash- will still be emailed to subscribers as Alerts.
Sunday, December 2, 2012
T2 and VTV Updates...12.2.12
Here's the line per Friday's close. We typically don't see IWM in the #1 slot and when it happens it often is a harbinger of impending bullish gains.
GLD has really fallen off the charts, having moved from #1 to #11 in just 4 days. It's due for a rally at this point.
The VTV model is supportive of the bullish case. Note that I've accelerated the Polynomial function from 5 to 6 degrees (now termed "P6"). We just have to be prepared for the turn once the P6 begins to fade.
Monday I posted the templates for the T2 and VTV software along with your options as subscribers.
There will be some upcoming major changes to the format of the Newsletter to hopefully provide you with more opportunities to conduct research on your own while still offering a baseline of delta neutral models designed to buffer risk and control drawdowns.
For current subscribers there will be no additional costs and, depending on the subscription and software option chosen, you may actually receive a partial refund.
GLD has really fallen off the charts, having moved from #1 to #11 in just 4 days. It's due for a rally at this point.
The VTV model is supportive of the bullish case. Note that I've accelerated the Polynomial function from 5 to 6 degrees (now termed "P6"). We just have to be prepared for the turn once the P6 begins to fade.
Monday I posted the templates for the T2 and VTV software along with your options as subscribers.
There will be some upcoming major changes to the format of the Newsletter to hopefully provide you with more opportunities to conduct research on your own while still offering a baseline of delta neutral models designed to buffer risk and control drawdowns.
For current subscribers there will be no additional costs and, depending on the subscription and software option chosen, you may actually receive a partial refund.
Subscribe to:
Posts (Atom)