Friday, May 31, 2013

T2 XLF (Financials) Portfoliio

This is a strategy previously mentioned...the goal is to select a sector ETF that is performing well and then construct a rotational momentum portfolio based on that ETF's components.  As with all momentum models the caution is to exercise stops when they fire thus preserving accrued gains and avoiding drawdown givebacks.
In that vein here's a look at the XLF portfolio based on the top ten holdings with SPY as a benchmark.

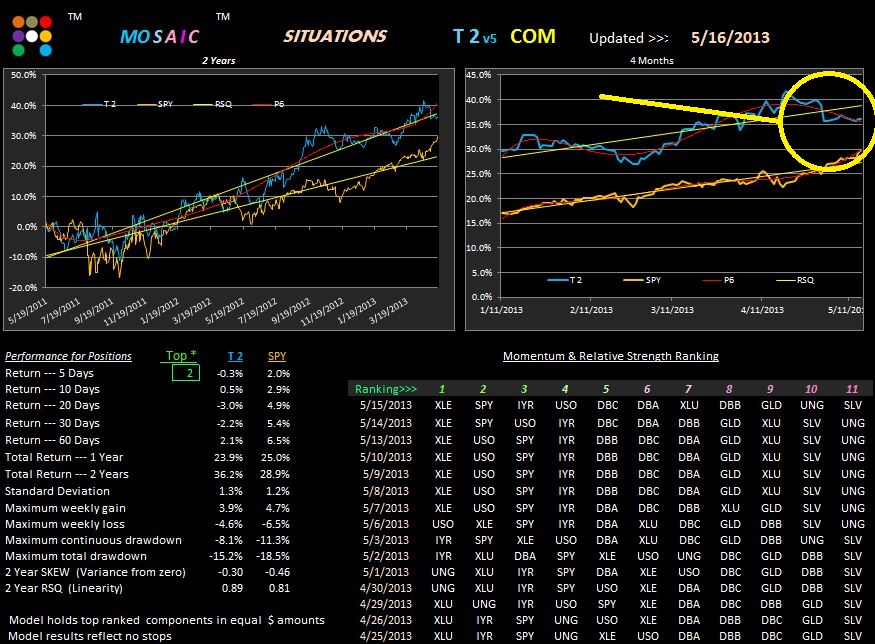
The problem with this approach (there's always a problem) is that we have now added volatility by trading stocks...a situation that is reflected in the standard deviation metrics and the RSQ value of .63 for the model..considerably less than the SPY at .84...and which can be seen by simply looking at the 2 year comparative chart below.

Just for fun you can run a top 1 sort of this portfolio and check out the 70% return over 2 years....it's the drawdown that's of concern with that sort and hence the ongoing caution to strictly honor the money management stops when they trigger. From a practical standpoint this means paying close attention on a day by day basis to how the markets are behaving...a requirement that most long term investors will not find attractive.
Click once on chart to enlarge and clarify.

Thursday, May 30, 2013

Commodities Still Negative...5.30.13

The commodity model which had been delivering stellar returns until April is now profoundly downslope.

The P6 4 month chart caught the turn and the cross of the P6 and the RSQ was a double confirmation that equity was going to suffer and cash was the safer choice.  The momentum rankings were correct but after April 15 th it was more a case of which ETF was falling slower.

XLE still looks like the best of the bunch technically...the rest of the portfolio is strictly hands off...for now.
GLD is next in line for recovery but is still displaying a bottoming pattern and we have to be alert to the "trap door" setup mentioned in previous posts wherein a perceived rally turns into a plummet to new lows.
Click once on chart to clarify and enlarge.

Wednesday, May 29, 2013

T2 Update...5.29.13

The markets are acting fickle this morning with > 1% drops in most of the X sector ETFs, except XRT and XLF, which is only down 3 tenths of a percent. Nevertheless we are seeing a strong momentum reversal based on technical resistance levels and uncertainty about the longevity of the FED's buying program.

The situation with the VIX mentioned yesterday was a telltale that something was not right with the bullish action and today bears witness.  The VIX is up 7% as of 90 minutes in.
Bonds took a tremendous hit yesterday but are showing some modest recovery today.  The 4 lowest ranked ETFs.. IEF, TLT, XLU and GLD continue to falter although all are overdue for a bounce.  XLU...which had been the darling of several of the model portfolios is now profoundly downslope.

Despite yesterday's pop the 4 month P6 has been downslope since the May 20, which was a sign to move to cash and defer any new positions.

Note the action on the SPY TrendX chart in the right hand panel  >>>>>>> 
Click once on chart to clarify and enlarge

Tuesday, May 28, 2013

X Sector Focus on XRT and XLF

A tremendous pop at the open today reflected high consumer confidence reports, accompanied by data indicating the highest housing prices in 7 years. 
This rosy scenario is reflected in our T2 X sector model showing retail (XRT) and financials (XLF) leading the momentum pack.  There's not a lot of difference between XLY, XLP and XRT...they all relate to consumer buying...but XRT tends to display a bit more juice than the more diluted staples and discretionary based ETFs.

Last week's selling has been reversed with today's gains and bonds are hitting new lows.
Gold is in a tight trading range despite some high volatility days...so its a traders game on that issue.
The VIX is surprisingly high at 13.75....based on on uber bull action today we should expect readings in the low to mid 12s...generally a sign that substantial hedging is at work under the surface. 

The new T6 version 6 Lab file will be going out this morning.
A little delay over the weekend  target date due to some computer problems but those issues are now resolved and we're back on track.

Friday, May 24, 2013

T6 Bullish Model Rolls Over...5.24.13

The market pullback this week has triggered the P6 and RSQ stops in both the all in (top 6) and top 2 versions of the T6 Bullish model. 

Despite positive fundamental news there's underlying concerns that the S&P has reached a technical high and is overdue for a pullback.  Pullback volume has been light and we  haven't seen the advance/decline line (NYAD) crumble to single digits....the usual indicator of true selling so we're still in a wait and see mode.
Nevertheless, from a capital preservation standpoint, closing the top 2 T6 and assuming a cash position at least temporarily was signaled 2 days ago.

Note that there have been some refinements to T6, including a 1 year metric, and the new version will be sent to all users over the weekend as a complement to the longer term T6 weekly platform. 

Thursday, May 23, 2013

T2 versus T11 on SA Model...5.23.13

OK...that was what is known as a key reversal day yesterday.  What today will bring is anybody's guess but we're starting out with a lot of red on the tape and some of the majors are taking heavy hits.
Good news for gold and bonds...for now.

In response to a subscriber question here's a look at the SA portfolio mentioned yesterday and updated as of Wednesday's close using a top2 versus a top 11 (all in) sort.
Remember...these are stocks forecast to outperform the SPY during 2013 so there's no delta or beta neutral buffer....these are supposed to be the best of the best...so no hedging our bets in this portfolio and risk management for this type of model is definitely a must.

Yesterday's action was actually a timely opportunity to test the validity of a 100% bullish concept (SA)  as we can see that the top 2 sort suffered a big hit while the all in model's loss was moderate.  (CSCO alone lost 2.5% yesterday). Now, this isn't an endorsement for the Seeking Alpha portoflio...I have no financial relationship with them...we're just looking at the argument for supporting a diversified bullish portoflio..even when things start to fall apart. A followup lookback tomorrow should be instructive.

Note that the equity line in both the top 2 and top 11 sorts has crossed through the P6  and now approaches the RSQ stop line. The top 2 sort looks grimmer than the top 11 model, but this could change quickly and strict observance of stop settings is (as always) strongly recommended.

Click once on each chart to enlarge and clarify.

Wednesday, May 22, 2013

SA Update.. 5.22.13

At the beginning of the year I mentioned a stock portfolio created by the Seeking Alpha group...its all stocks and not the usual focus of my ETF explorations, but reader interest prompts me to update the results.
Since stocks tend to be considerably more volatile than ETFs we should expect the drawdown metrics to be more unstable than the benchmark SPY.....this does not appear to be the case with this particular group of stocks.
Just for amusement I've noted a top 1 sort and a top 2 sort.  Over the longer term the #1 ranked stocks tend to have "runs" that typically last 5 to 10 days, although O's  (Realty Income) recent run extended 30 days and CSCO's previous run was 45 days, so frequent trading of positions, while expected, is not necessarily a function of the portfolio.
And now a top 2 sort.  Click once on each chart to enlarge and clarify.

Tuesday, May 21, 2013

T2 X Sectors Update...5.21.13

A quick check of our Spyder X sector model shows XRT and XLF (retail and financials) still holding top slots.  XLK (tech) has lost its some of edge after showing substantial promise.

When we look at the actual numerical values for the rankings over the past 5 days we see that the differentials are not substantial but more a matter of a few points and in some cases (such as XLE) the ranking value is equal to a higher ranked ETF (XRT), but the previous strength of XRT makes it the ETF of choice in a top 2 sorting.


Click once on chart to clarify and enlarge.

Monday, May 20, 2013

T2 Default Struggles to Keep Pace...5.20.13

Posting is late today.  A broken water pipe in the kitchen kept me at home working with the plumber to contain the damage before a $200 problem became a $2000 problem.

OK, Back to the real world.
Markets are under pressure this morning.
How long can this rally keep going?  Every dip seems like a buying opportunity.
It's anybody's guess when the momo will end and not a few "smartest guys in the room" have lost fortunes recently betting against this market.
Best guidance is generally to follow the trend and be prepared to exit when stops triggers.  Sound familiar?
T2 still likes QQQ and IWM, with XLE looking to keep in close contention if we look at the 4 month charts.
Bonds just can't get any traction, although today's pop in gold may signal a positive move in that issue at least short term.
Click once to clarify and enlarge.

Friday, May 17, 2013

T6 Bullish Model Improves...5.17.13

We looked at the T6 bullish model on Monday and today's update shows a modest improvement in the overall metrics.  XLU (utilities) are once again showing some accumulation, while XLF (financials) are leading the pack in gains and IWM (Russell 2000) slightly leads the SPY in the short term.
The momentum rankings have held the same top 3 components for the past 10 days, with a little tradeoff between QQQ and IWM in the #2 slot.

One interesting variation of this model is a top 5 sort, so the 6th slot just stays in cash on a rotating basis.  Using this approach cuts down on commissions and produces approximately the same returns as a top 2 sort...as long as the markets remain bullish.

On Fast Money last night Cramer fielded a question from a viewer who thought C (Citigroup) was over bought at this level ($51).  Cramer noted that C still had almost 500 points to go up before it reached 2007 levels, so everything is relative and he sees plenty of upside potential in XLF (for now).
(This is not an endorsement for XLF or Cramer....he's been stunningly wrong before)

Thursday, May 16, 2013

Bonds Rally....Commodities Still Lag....5.16.13

We finally got a bounce off the TLT bottoming target at mid $ 116 yesterday and are seeing a continuation today.
Other bond ETFs followed suit and we may see some progress in that trend for at least the next few days.
Meanwhile, the Commodity model continues to lag, but positions should have been exited several weeks ago once the P6 went downslope and especially when the RSQ line was violated, thus avoiding the recent net drawdown.
IYR (real estate) and XLE are the best looking charts in the sample portfolio but the metals (GLD and SLV) are still deteriorating and continue to slide further down the RSQ slope.
Click once on chart to enlarge and clarify.

Wednesday, May 15, 2013

T2 X Sector Update

Bonds had another nasty drop yesterday after after an attempted rally.  Traders call this setup the "trap door" because just when you think a bottom buying opportunity has developed, the buying suddenly evaporates and a new low is reached.  TLT has now attained that status and has been driven down to the 116 levels, which have provided support in the past so we may now be seeing a more realistic bottoming setup.
XLU, which has gotten hammered over the past few sessions is also on the comeback trail

Over on the X sector portfolio not much has changed, with the retail XRT showing the best momo followed by XLY (consumer discretionaries), XRT's closest functional ally. XLF is trying to nudge into a top 2 position but market sentiment is favoring retail for now.


Tuesday, May 14, 2013

T2 Update 5.14.13

Checking in on the T2 default portfolio shows QQQ retaining a top slot and IWM outperforming SPY.
Bonds just can't get traction and TLT had another big hit yesterday although up modestly today.
GLD is also lagging and seemingly unable to get any positive momentum going.
XLU may be bottoming out and shows positive momentum this morning, along with XLV and XRT.

Meanwhile, XLF is still the X sector leader in today's action.
Confounding today's action is the VIX (up 5%), which would normally be behaving inversely (negative) to today's positive equity action, but which may be setting up for this Friday's option expiration.
Click once on chart to clarify and enlarge.

Monday, May 13, 2013

T6 Lab..2 Views..5.13.13

The T6 Weekly version 2 program was emailed to all registered T2 users this weekend.
If you didn't receive it, drop me a note and I'll send it out.    ETFMosaic@aol.com.

Today we'll look at the updates on the T6 LAB platform, which uses daily bars to track momentum, for the bullish and the market neutral portfolios.
As of 2 hours in today the Qs and XLF are leading positive issues, a situation foreseen by Friday's closing momentum on T6. This, of course, could change significantly by the end of the day.
This view is using a top 2 sort but users can play around with other sorting options.
The bullish portfolio incurs almost as much drawdown as the net SPY with about a 10% improvement in RSQ and SKEW.
We can contrast this model with the sample market neutral model which requires no trading...its all in top 6 all the time...and which reflects reduced net returns but stunningly low drawdowns.
This is clearly a long term portfolio as the shorter term returns are dismal when compared with the SPY. Monthly rebalance of the portfolio components is suggested in order to maintain equal dollar weighting in the 6 positions.
Also note the substantial improvement to both short and longer term RSQ and SKEW values in the market neutral model.

Friday, May 10, 2013

T2 Commodities on Downturn...5.10.13

The T2 Commodities model has been under pressure recently as can be seen by the metrics.... which was forecast by the downslope P6 on the 4 month chart...especially the cross of the P6 and the RSQ back on 5/1. 
Commodities in general are showing weakness with only IYR (real estate) and XLE showing positive P6/RSQ alignment out of our 11 ETF portfolio.  The sector is clearly under selling pressure.
Weakness generally begets more weakness when we see this ominous cross and risk management guidelines argue that going to cash during such situations is the prudent course of action.  Yes, we incur some trading costs while we await a new upslope P6, but the drawdown savings can easily make up the difference.

The big loser in today's action is bonds, especially 20 year treasuries...TLT...which is currently down 1.75% just 2 hours in.
TLT has been in freefall since 5/3 ...losing $6 in as many days. 
Previous February support was at the 115 level ..another $3 down from the current $118. 
This is not a good time to be bottom fishing TLT...or bonds in general.
Ditto for commodities.

Thursday, May 9, 2013

T6 Weekly with XLU...5.9.13

This is a version of the T6 weekly model using XLU (top study) in lieu of SDY (bottom study) posted . 
The study uses a top 2 sort the results display a reduced drawdown and greater linearity for XLU.
Reflecting the recent run up in the market the last 6 months the sorts have lagged the SPY while the 2 and 7 year results have been on par with SPY with dramatically lower drawdown.
Looking back over the past 4 months the top 2 holdings have been SPY and XLU, so not a lot of trading required here. Ditto for the SDY version.

I've made a few changes to the T6 weekly model and will be emailing out to all registered users this weekend.  The momentum algorithm has been smoothed a little to reflect the weekly bar timeframe but is basically the same as the original version.  The metrics panel has been modified a bit, a one year lookback added and some behind the scenes technical alignments have been refined.
Click once on charts to clarify and enlarge.

Wednesday, May 8, 2013

T2 X Sector Rotation...5.8.13

The X Sector model has undergone a reshuffling of rankings as XLU and XLV lose momentum and XLK (tech) and XRT (retail) pick up steam. 
XLE (energy) has also been showing strength as crude bumps and prices at the pump rise once again...just in time for the summer holiday driving season.
MSFT is losing a little juice after hitting multiple consecutive highs although Apple continues its recovery run, the main driver for both QQQ and XLK gains.
XLF continues to make solid gains and we may expect its ranking place to rise in the next few days if the current rally has legs.
 Click once on chart to clarify and enlarge.

Tuesday, May 7, 2013

T6 Update + Alternate Portfolios

Here's a check on the T6 Bullish model which is still chugging along and now has QQQ and XLF in the top2 slots...as mentioned yesterday this is the oft recognized precursor of bullish more sentiment.
XLU and XLV have rolled over...at least temporarily...having made the greatest gains of the 6 components.
The change in momentum can be seen clearly by looking at the 5 Day and 10 Day return columns.

For those readers interested in doing a bit of testing with the T6 software, including the weekly version, I have added a few more T6 Sample Portfolios in the USER REFERENCE section (in the right margin), including a beta neutral and beta negative model.  These models have performed well using the T6 weekly software and a 7 year lookback and constrain drawdown dramatically while still approximating returns of the SPY.
Since most readers want a low maintenance portfolio these models may provide some useful guidance.
We'll focus on expectations from these models in upcoming posts and explore alternate top # sorts.
Click once on chart to clarify and enlarge.

Monday, May 6, 2013

T2 Shuns XLU...5.6.13

The T2 default model has cast our long term winner XLU to #4 slot and today's current -1.25% hit to that ETF will probably push it even further to the right.
The Qs have been the big recent winner, driven by Apple and MSFT.  When tech and the financials (XLF) lead the market sectors this is typically a sign of bullish underpinnings and more upside to come
On the other side of the coin is this posting from Zero Hedge re: Goldman's assessment of possibilities for the rest of the year. These periodic postings from Goldman have a checkered past of reliability and need to be considered with a touch of skepticism but the analytics do argue for at least a pause.
Click once on chart to clarify and enlarge.

Friday, May 3, 2013

T6 Weekly Revised Model..5.3.13

This is a little different version of the T6 weekly model...in this case IEF (Total bond ETF) has been replaced by SDY (SPY dividends ETF).
Depending on whether a top 1 or top2 strategy is engaged, the trading frequency is quite low and the drawdown is well contained.
Somewhat interestingly the SDY has been showing considerably more momentum than the SPY for the past several months...reflecting an underlying flight to safety, even as the bonds ETFs have consistently underperformed..
Click once on chart to clarify and enlarge.

Thursday, May 2, 2013

T2 Commodity Model SwingsBack to UNG...5.2.13

Following Wednesday's downswing we're seeing some selective recovery 90 minutes in today. 
A stellar jobless claims number is supposedly the driver for the pop but, in reality, this is, as usual, a convenient backstory from the media talking heads to explain market dynamics.
Looking at the markets in the rear view mirror is always easy...forward looking is always a bit more difficult.

The X sectors are all doing well today...with the exception of XLU...which, although it moved back into #1 rank of the X Sector model today, is now long, long overdue for a pullback.
It is because of this rotational risk that several T2 models are profiled offering a more delta neutral perspective (T2 default), a non-correlated equity/bond model (T2 COM...Commodities), and a bond centric model (T2 Bonds & FI).
Our ongoing thesis is that allocating portions of investment capital to each model mutes the inherent risk associated with focusing on just one income modality.

In that vein here's an update to the COM model, which has once again cast UNG as the momentum leader.  This position was abdicated last week for a few days as XLU took the lead, but the XLU/UNG slots have switched again.  Of our 10 commodities (not counting benchmark SPY) only UNG, XLU, XLE  and IYR have upslope RSQ on a four month lookback and XLE is very jumpy on the line.
Click once on chart to clarify and enlarge.

Wednesday, May 1, 2013

T2 X Sector New Lineup...5.1.13

There's been a little switch in the top 2 slots this week as XRT (retail sector) assumes the #1 slot.  It's been lurking over at #2 but now shows new strength. 
XLV (health care) has meanwhile crumbled to last place although a quick look at the charts would not suggest such weakness.
In today's market action the advance decline line is currently flatlined at .50...90 minutes in.  This is a moderately bearish reading based on sub par volume so its difficult to predict what momentum will do....over the .5 ledge and down or a springboard back up to a more neutral balance of advancers versus decliners.

The only X sector ETF in the green this morning (so far) is XLP (consumer staples) which is up 17% since January 1. The 4 month charts of XLU and XLP look identical by the way.