Monday, December 31, 2012

MO2 Possibilities...12.31.12

Here are a few positively correlated pairs using the MO2 software to analyze potential trades.  I'm focusing on the SPYDER sector ETFs, previously discussed, to explore another route for detecting impending momentum both within the larger T2 default model and as a stand alone trading strategy.  I've also included a GE/QQQ pair that shows promise and long time readers know my special interest in GE as a trading instrument...I like it.
  Now a couple SPYDER pairs:
As you can see... we can mix and match the sector SPYDERS to both confirm current momentum and to see how that momentum is related to the other sectors.  This is a good edge to have when looking at potential trades and, here's a little bonus, we get quantified forecast of how long the current trade should last before risk overcomes reward. 
Now not all pairs look as attractive as this bunch.  That upsloping continuous equity curve (RSQ line) (orange line) is actually the most important metric to consider when taking these trades.  If current equity is below that line then something either technical or fundamental has gone awry and its best to just stand back from the trade until the RSQ and trade equity get back in line.
There's a lot more flesh to put on these pair bones to make it a whole system but these examples should give an indication of the possibilities.

90 minutes in today...16 hours until 2013 and the Congress  looks unable to reach a meaningful compromise on the pending fiscal mess. We're seeing some volume pops this morning and attempts at a rally but one of the NYSE floor traders on CNBC called it a "Fools Rally" that should be sold, not bought.  We shall see.

Friday, December 28, 2012

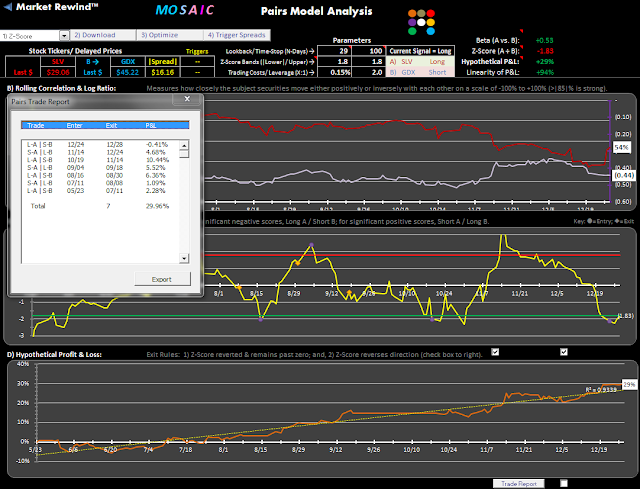
MO2 Pairs...GDX / SLV...12,28.12

Looking forward to 2013 there may be some tough going so we need to consider Plan B.  Despite all the economy cheerleaders pounding the table that 2013 will be a go-go year there's a lot of evidence to support a contrarian viewpoint.
One way to work around the risk system is with a pairs approach...which is a hedging strategy with definable risks and predictable odds. 

In the past we've mostly focused on inverse pairs such as QQQ / SH, which is essentially either a double long or a double short. In the coming weeks we'll look at more arbitrage based pairs where we are looking for the strongest, highest momentum side of a correlated pair. 
In the case above MO2 looks at the relationship between silver and the gold miners (SLV/ GDX).  This is one of those boutique pairs that combine a fundamental relationship (metals) with technical price alignments in response to the world economies 
The lookback is limited to 6 months but the results are a good example of the profile we're looking for...a solidly upslope equity curve (orange line) and a clear definition of trading thresholds (yellow line).
The duration of the average trade is 29 days, which means you may see some drawdown along the way. 
Again, this is just an example.  We'll look at some other compelling pairs in the New Year.

Thursday, December 27, 2012

VIX >20...12.27.12

Today's news centers on the VIX rising above 20 for the first time since July 23.  This is a weekly chart with a few of my favorite technical indicators.  For active traders the 2 SMA8 lines on the chart are of the high and the low...creating a support resistance channel that is amazingly reliable fro reading new trend breakouts.  Note where the VIX is right now.
The chart has a yellow line overlay showing how TLT has historically reacted to the VIX and the point of interest is that TLT has never resolved back to the VIX baseline (like April 2011). This is a stark graphic view of the potential bond collapse that is contributing to market nervousness.
Of course things could turn around in an instant but the odds are looking increasingly with the bears.
Here's one doomsayer's comment.
And, just for reference here's a look at the SPY/TLT pair study supporting the bears once more.
Those of you that have the daily Market Rewind subscription can replicate these pair studies.

Wednesday, December 26, 2012

LM and TAQK Updates...12.26.12

Software Updates:   VTV version 4 was sent out last Friday and the updated T2 version 4 was sent out Sunday so all readers should have received the package you signed up for.  If you haven't received the files please let me know.....   ETFmosaic@aol.com

The RM (Risk Managed) versions of both the LM and TAQK models went back to CASH on Monday's close.  Monday was technically speaking a non-event with extremely low volume and shortened hours. Historically, such days tend to be bullish and, coupled with the Santa effect, was the generally expected result.  Which only goes to show that Hope is not a strategy. Gold and bonds continue to lag equities, even in the face of overall market weakness.  The SPY TrendX chart at the right side panel shows where we are and where we're likely to go if the markets continue their current trend...back to previous lows.

The NYAD is in a solid sell off this morning (8 am PST) but still holding up fairly well at .81.  With shortened trading on Monday and the markets closed Tuesday the end of this month could be a real firecracker.

It's looking more and more like no fiscal cliff solution solution will be forthcoming by the end of the year and the big push now is for a stop gap measure to at least preserve the status quo.  Its still a wait and see game.

For those tracking LM and TAQK ...Friday is rebalance day, when we realign position sizing to reflect the model allocations.


Monday, December 24, 2012

MO2 View... 12.24.12

As we move forward into the new year there will be an increased focus on pair trading (MO2) research...both inverse pairs (such as QQQ/SH) and correlated pairs such as (AAPL/IBM). There's a reason that some of the largest proprietary trading shops (like Bright Brothers) use pair trading as their main trading mode when not playing arbitrage on the open and the close....it provides much better odds for success than simply trying to guess directional moves.

MO2 has a live data feed and here's a look at today's QQQ/SH signal...also the focus of our VTV model, but obviously using an entirely different set of metrics to analyze the trade potential.  We're into the QQQ short trade 7 days now and with a predicted optimal excursion of 9 days, it's getting close to exit time.
This optimal time window ("N- Days") is critical and the failure of the trades ending on 08/30 and 12/05 can be traced directly to dallying too long and not cutting the trade off after 9 days.

As far as the near term picture for the markets...we have the last day of the month bullish potential fast approaching versus the realization that we may go over the the fiscal cliff.  If there is ANY remedy to the crisis its likely to be stop gap and not far ranging or long term....so the markets will likely continue to climb the wall of worry. 

We continue to be in a cautious mood and today's action where QQQ and TLT are both in the red reflects the ongoing technical confusion in the markets

Friday, December 21, 2012

NYAD and VTV View...12.21.12

I've talked about the NYAD (NYSE advance/decline line) in previous posts.  In my opinion it's the best view of true market momentum...devoid of the high frequency trading bias the typically infects intra day statistical oscillators. This is a 12 day lookback on 30 minute bars.  That's us today at .36 as of 90 minutes in.  The yellow line is an overlay of the VIX so you can see how volatility and the NYAD work inversely to one another (normally).  We also know that true selling doesn't end until the NYAD reaches into the low teens or single digits.  On the other hand, this is a strong seasonal period with low volume.  That's picked up today because its monthly option expiration and traders are looking to reset or rollover positions....but premiums are so low these days that its hard to find good situations to make some premium decay dollars on, say, covered call positions without focusing on high beta (think high risk) stocks.. 

The move to restrict our short term positions to IWM in the T2 model (noted yesterday) played out well today as IWM is only down .9%, while SPy is down 1.2 and the Qs are down a whopping 1.9%.  We took a hit, yes, but so far its a modest one and we avoided compounding the error by being out of XLE and XLU, both also in the red today.

The VTV model was suggesting that today's slide had a high probability. The TrendX was dead on the zero line for the IWM/TLT pair...indicating a bad time to take on new IWM Longs, but more importantly, the VTV chart below the metrics panel had P3 and P6 divergent....a clear signal that momentum between the IWM/TLT pair had reached a "breaking point".  Although all the other chart signals were in a confirming mode, this one was not and should have provided a caution to stand back from any new trades and/or provided a signal to go to cash until the P3 and P6 were once again in sync.


Thursday, December 20, 2012

T2 and VTV View...12.20.12

GLD and TLT show continued weakness and volume dries up ahead of the holidays.  IWM continues to eke out small gains and remains the T2 top pick.  XLV slid off the top 2 list on the 17th, missing the rally on the 18th but avoiding the big drop on the 19th...net result...good save. Based on our risk management caveat in the lower left of the T2 metric panel, IWM is the sole holding currently.

Just for entertainment I've put up the modified VTV view (click on image once to enlarge) only in this case I've made XIV the benchmark and SPY just one of the pair components.  Now you can see how wild VIX actually is.  Love to have that 94% retrun over 2 years but that 79% drawdown might give you an ulcer along the way.  That's why we trade this ONLY SHORT TERM and USE STOPS...no second guessing.

Note that I've dropped VXX off the mix and in a future post I'll show why this may be a prudent move in analyzing the potential of these trades.  When VXX was first issued 2 years ago I ran a series of posts suggested that this was the shorting opportunity of a lifetime and that the only way VXX could go was down.
For now we'll just excuse VXX from any trading consideration and just use it as a statistical benchmark with a built in decay function.

Wednesday, December 19, 2012

LM and TAQK Updates...12.19.12

The RM versions of LM and TAQK remain vested although the continuing weakness in bonds and gold has kept the models under performing the SPY in the short term.  I need to modify the 4 year APR returns as the end of 2012 approaches and that we will done by next week.

Volatility continues to be the name of the game.  The VIX (volatility index) was down 5 % yesterday, while today it's already up 5.5%.  What we are seeing within this context is that the % daily change in the VIX is NOT necessarily related to the % change in SPY or the DOW, but moving in response to another set of drivers.  Option expiration is this Friday and that may be part of it, but the uncertainty factor is making this a real whipsaw market for now.


Tuesday, December 18, 2012

VTV View... 12.18.12

This is the metrics panel of the VTV upgrade to be released later this week. Because there's so much info here you may have to click on the image to enlarge and view properly.  Same story with the chart portfolio below. 
Many market gurus have suggested that with Obama's election there are 2 sectors likely to outperform the rest of the markets...IWM and XLV (small caps and health care). Taking that cue I've replaced the Qs with IWM in the VTV mix and the resultant lineup of momentum is pretty amazing with XIV and IWM consistently in 1 and 2 slots.
On the downside the charts have the bond ETFs looking just plain awful, with TLT taking a huge hit Monday and following up with another big slide so far today. GLD is stalled in place, still looking for a rally.
Logically speaking (which seldom applies to the markets) the bears should be leading the way, but expectations for a fiscal cliff solution and anticipation that retail sales will help bolster the markets have us solidly in the green.  Plus, this is seasonally a bullish tile of year as hope springs eternal for the new year.  For now we just have to follow the signals and be ready to exit at the first sign of a reversal.


Monday, December 17, 2012

Deconstructing the S&P with T2 & SPYDERS...12.16.12

This post is fundamental to understanding rotational models and identifying pockets of opportunity. Without going into too much nuance right now we'll use the SPYDER sectors ETFs to help isolate what's hot and what's not in the markets on a momentum basis and try to capture incremental grains along the way.
.
To provide a comparison benchmark we add SPY to our porfolio.  This gives us a 10 ETF model to examine and to see if there's any advantage to playing the sectors selectively based on momentum or whether we're just better to guts it out and hang with the SPY.  Turns out there are some benefits to playing the markets selectively both in terms of risk and returns.  In this case I've looked at the top 3.  With the T2 software you can load up this portfolio, save it as a separate file, and analyze the other possibilities.

As expected, money management is important but if we follow the simple RSQ and P6 guidelines we are way ahead of the buy and holders. While the top 3 chart mirrors the SPY chart it clearly shows higher lows and higher highs, the types of portfolio price behavior that we seek in order to get an edge.
To get a little different look at these sectors....here they are all together in the T2 composite chart. At first glance you'd probably be inclined to say..."well, they all look the same", and in fact they pretty much do.
It's when we apply a momentum algorithm like T2 to a sample mix like this that we may discover some nuggets of opportunity not readily apparent.

Friday, December 14, 2012

T2 Exploring and VTV View...12.14.12

Here's the revised VTV chart set (to be released next week).  I've added a P3 function to complement the P6 (P3 is slower).  This begins to look like a moving average crossover or MACD chart now and helps define the nexus of Long/Short opportunities as will be discussed in future posts..  I keep talking about technical "normalcy" in the markets and these 6 charts provide a quick and reliable view of whether the markets are trending or choppy.  There's a reason the charts are aligned the way they are.                      There are 3 pairs here: QQQ/SH, XIV/VXX and SPY/TLT.
The 3 charts on the left are equity positive, the 3 charts on the left are equity negative.  Ideally, we want to see all 3 charts on the left sloping the same direction and all 3 charts on the right sloping the same direction. That's clearly not the current situation and a good reason to be wary of potential short term trades.
This conflicted view of the markets is supported by the current momentum rankings of VTV which show SPY with a higher ranking than XIV.  This scenario is typically an indication that market volatility has reached (or is approaching) a short term low (remember XIV reflects the VIX inverse) = bearish.  If the fiscal cliff, the current focus of bearish sentiment, appears to be somehow solvable, then all bets are off and we'll likely see a couple hundred point move up that will hold for at least a couple days.  for now, it's the wait and see game for traders.

Now, back to T2, which all subscribers except one have opted to own.  One thing to keep in mind when exploring with T2 is that not all portfolios lend themselves to momentum based rotational modeling...or, if they do, they require really tight risk controls, aka stops.  Here's a couple sector portfolios to consider as a reflection of this thinking.
First...commodities..often cited by "experts" as an inflation proof tactic for avoiding losses.  This model includes all the basic commodity groups, oil gold, agriculture, mining, basic materials, etc.  See for yourself how it's fared relative to out default portfolio.  Note the drawdowns.  I've just selected the top 1 for analysis but the results don't get much better the more risk control (higher top#) that we select.  Looking at the lower charts of the portfolio SPY and GLD are the only components that are even remotely attractive.  The overall downward slope of most of the components dooms the success of this model from the get go.  This may be a short seller's dream but as a longer term portfolio there's simply not enough positive momentum in this sector to beat the SPY unless you stricke like a black mamba and capture all the surges above the RSQ while avoiding all the drawdown below the RSQ line.  Like I said....close attention and tight stops.
.Tomorrow, we'll look at another T2 portfolio that looks promising on the surface.

Thursday, December 13, 2012

T2 Bonds Only and VTV View...12.13.12

Based on reader feedback the ultra low drawdown models have gained a following.  Here's another one featuring a 5 ETF portfolio of bonds only and no need for following the Momentum rankings.. just hold all 5.  Note that the benchmark is TLT, not SPY.  I've made a few additional tweaks to the T2 program in the past few days and version 3 will be sent out this weekend.

In the big picture the markets continue to seek a new trend.  The chop is evident in the VTV rankings as seen below and mentioned yesterday.  While the XIV - VXX spread remains intact the collapse of QQQ and SH to slots 3 and 4 negates the opportunity for any short term trades (Long QQQ).  As of 90 minutes in today's market session both the Qs and SH are green while XIV has turned red.  The odds for a fiscal cliff solution seem remore at this point and Friday may be an ugly day if current bear sentiment prevails.

Wednesday, December 12, 2012

LM & TAQK Updates + a Long Term T2 ...12.12.12

The models are slightly underperforming the SPY on a short term basis but our volatility factor (drawdown) stills hold the edge. Both LM and TAQK remain in Hold mode and both the RM versions are Vested.  We might have picked up some gains in the Mosaic models by kicking into an ACCUMULATE mode back around Nov. 19th but the technical signals to confirm the underlying foundation for such a position were not present.  We continue to see the markets see-saw in anticipation of the fiscal cliff (now dubbed the dismal cliff by some in the media).  For now we'll look to the VTV setups to pick up some short term gains and preserve our capital.

Since you asked:  here's a 7 year look at the VTV really low drawdown model posted yesterday. In this case we do engage the top 2 strategy but the algorithm only looks at weekly bars, not daily bars as in the typical T2 model. All indications are this is a robust model requiring minimal maintenance and a providing a safe place to park some of those long term dollars that would otherwise be in money market or piddling CDs. Another attractive feature:  incredibly liquid...convert to cash in less than 5 minutes during market hours.  Note what happened in late 2008 when the SPY hit a nose dive.

And, here's the TAQK update.

Tuesday, December 11, 2012

T2, VTV applications,etc....12.11.12

Most of you now have the T2 software to play with and create your own model portfolios so I'll limit my previous focus on T2 for a while.  There are no new Alerts and the markets continue in conflict with Monday demonstrating a somewhat bizarre returns as QQQ, TLT and GLD were all green and XIV was red.  Today it's Apple that's driving the Qs and the materials sector is flying.
T2's selection of XLP and IWM since 11/29 has worked out well but the model still remains in a stopped mode per the short term RSQ and P6.
The VTV model continues to favor XIV (the VIX inverse=bullish) ranking and after today's Qs action we may see the rankings fall into the ideal alignment with Qs in #2 slot and SH in #5.  Until then we need to be sure that today's early rally is not just a short covering event.

Below is an example of one of many peripheral ways that the VTV Assist program (bundled with the VTV main program) can be used. While the VTV program is focused on capturing short term gains it can also be used to build long term portfolios with less than 6 components.  In this case the model holds all 5 ETFs in equal dollar amounts...and holds and holds and holds.  We just need to rebalance every month to make sure there are equal dollar allotments  in each ETF.  The results...we slightly beat SPY but the drawdown is miniscule. The RSQ of .98 tells the whole story. We actually don't even need to look at the Momentum rankings.

Monday, December 10, 2012

T2 Software and the VTV View...12.10.12

The T2 software was sent out this weekend to all subscribers who requested it.  The VTV software (2 separate programs) is now available also..go to the option 8 button on the main ETF Mosaic site to order.  The VTV software is both very simple and very powerful in helping to assess market momentum and to capture short term opportunities.  Risk management is critical with VTV...as can be seen by a quick look at the performance metrics of just trading the top 1 ETF in the 6 ETF mix.  Great returns but the potential drawdowns could cause a cardiac.
We can buffer the risk somewhat by trading the top 2, which basically cuts all number in half but the goal of VTV is really to make sure we're on the right side of the market at any given time so however each user decides to engage the program is a matter of personal risk tolerance.

On upcoming Mondays we'll look at some other ways to make use of VTV, some other VTV components and some other ways to use the power of inverse pairs to capture market opportunities.  VTV is the product of over a year's worth of research and I'll endeavor to gradually explain why it should be part of your trading (and investing) toolbox.

Below is a view of the lower VTV chart panel which illustrates the extreme volatility that trading high beta volatility (XIV and VXX) can incur.  Also note the volatility chart in the upper right hand side of the VTV Assist panel.  That's one of the reasons that the preferred trading vehicles for VTV are QQQ and SH...less volatility. 

Saturday, December 8, 2012

T2 Update...12.8.12

T2 remains in a stopped mode.  The version shown above is a partial view of the T2 software that will be emailed to all subscribers requesting it per the earlier ETFMosaic revised subscription notice.  A VTV option 8 revenue button has been added to the ETFMosaic homesite and that software module is also ready to go for those wishing to purchase.

Apple (20% of the NAZ100) continues to drag down the Qs and produced the odd situation Friday where both QQQ and TLT were red.  The Momentum rankings have detected this weakness and have stuck with XLP and IWM as top ranked slots since 11.30.12  Considering the underlying chop in the markets this is a tenuous ranking going into next week.  The equity markets are technically overbought and with more and more market prognosticators predicting that a substantive fiscal cliff solution will not be reached any time soon the gloom and doom sayers may drive the markets down ahead of the holidays. Watch out for any short covering rallies before getting too negative. 

The updated VTV ranking with the optimum XIV/VXX spread but QQQ and SH are not in the # 2 and #5 slot,s reflecting continued instability in the markets.The rankings on 12.5 were truly strange with QQQ most closely aligned with SH than TLT...again...an Apple phenomenon.

Friday, December 7, 2012

T2 Special + VTV Trends..12.7.12

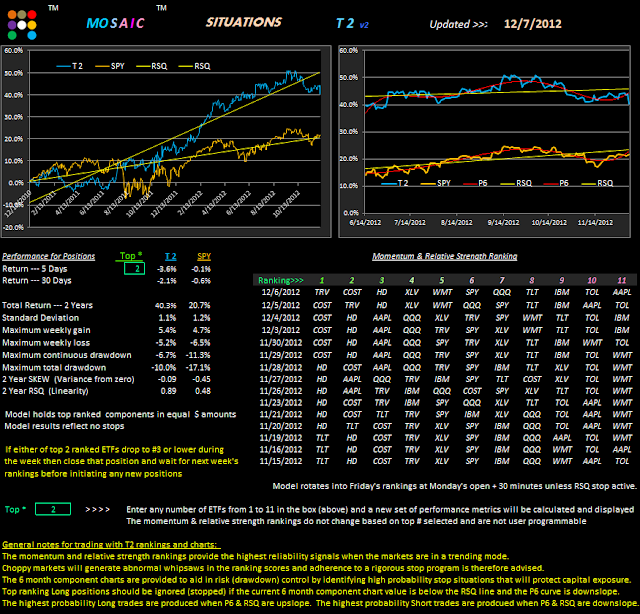
This, of course, is the main panel from the T2 software that subscribers will be receiving this weekend (Sunday).  I'll add an option #8 button to the main Mosaic site later today for the VTV program. Within a week or so, VTV will be issued as 2 programs...an analytical version mirroring the file below and one tracking the performance metrics.  For now, subscribers will receive the analytical version.

Just for curiosity sake I entered a few high flying stocks into the T2 mix (above) to see how they have performed relative to my default portfolio.  This model in particular highlights how valuable the RSQ and P6 stops can be in preserving capital.

With the T2 software in hand you can experiment endlessly with model portfolios of this type and you don't have to just look at the performance of the top 2...you can examine the top 1-11 performance with the click of the green box #.  You also don't have to enter 11 stocks or ETFs...you can enter any number up to 11.  I'm looking forward to hearing from readers on portfolios they have created that test out particularly well.

Below is the current VTV view of momentum. The fact that the SPY and XIV RSQ slopes do not match and the TLT and VXX RSQ slopes do not match illustrates the high degree of uncertainty in the markets...even as the VIX continues to hover around the 16 level.  These conditions typically presage a major market move...which way is the $64 question.

Thursday, December 6, 2012

T2 Update + Charts...12.6.12

No new Alerts today.  Actually, several of the alerts went short at yesterday's close so it will take at least a couple days to work off those signals.  Apple really took a bite out of the Qs yesterday and we're seeing some recovery today.  The financials led the charge yesterday although 28 out of 30 DOW stocks were green almost all day long on about 70% normal volume. 
Reflecting ongoing market uncertainty both TLT and QQQ are green today, while XIV, the hyper signal of bullishness, is alternating between flat and red.   A lot can happen the rest of the day but for now we remain in a stopped mode as our momentum leaders show signs of stalling on the charts while the bond ETFs are looking stronger.


Wednesday, December 5, 2012

VTV Tickler & TAQK, LM Updates...12.5.12

From the Mosaic Testing Lab here's some performance data on the VTV concept (this version only trades on a weekly basis) looking back 7 years.  Keep in mind XIV has only existed since 2011 and VXX has only existed since 2009 so the long term results are a bit skewed to the QQQ/SH extremes of the spectrum but the recent 2 year results are more an indication of likely outcomes of a true XIV/VXX spread. VTV is intended to trade only QQQ and SH so additional deconstruction of the momentum rankings will be required in the Lab to generate more realistic expectations.  In this version the model holds the top 2 positions.  Volatility increases substantially if we just hold the top 1 position.

As of 30 minutes in today (12.5.12) these are the weekly updates of TAQK and LM with the TAQK model revealing the weakness in GLD (gold) that is holding the LM model back...note the #6 ranking of GLD in the LM model.
TAQK is now in an Hold mode...Updated 8:00 am PST.  It opened in an accumulate mode but has now reverted to a HOLD status based on QQQ and XLK weakness.
 For our own portfolios the position allocations were rebalanced at the close on Friday and the next rebalance is scheduled for 12.28.12.

Tuesday, December 4, 2012

Software + Subscription Changes...emailed on 12.5.12

Just a heads up... the T2 and VTV software offering will be emailed to each subscriber on 12.5.12, along with the changes to the Newsletter format and your new subscription options.
Please respond back by December 15th with your choice.
Please be aware:  T2 and VTV are in EXCEL format and you must have EXCEL 2007 or newer installed on your computer to run the software.  In addition, you may be asked to "enable all macros" at startup and this is just a simple click of the permission button to activate.

T2 Update 12.4.12

Tuesday's update continues with a stopped mode and no new Alerts. Considering that T2 is a momentum driven model it follows that trending markets provide the best opportunity for capital appreciation...a situation we have not seen for several months, although there has been a downtrend tendency in the background.  We continue to experience anemic volume in the majors and momentum changes on a day to day basis, reflecting a high level of uncertainty in the markets.  The fact that the VIX continues to stabilize at the 16 level does reveal an underlying bullishness but as we inch closer to the January fiscal cliff deadline that may increase.
The component charts are shown below to help give some clarity to the issues at hand.
Note that Poly 5 has been updated to P6 ..the 6th degree version...which accelerates the momentum change indicator line by about 7%.

.

Monday, December 3, 2012

Big Changes Ahead...T2 and VTV Software Package


As we approach release of the T2 and VTV software here's a synopsis of what's included and what's not in the 2 programs.

Over the next day or 2 each subscriber will receive an email detailing ongoing subscription and software options. Since readers have started subscriptions at various times over the past year each case is calculated somewhat differently and that will be reflected in the pricing. 

Subscription and software options:
1. Continue with subscription for duration of 1year term = $150 (you will receive a pro-rated credit based on the initial $250 fee) .
2. Cancel subscription and receive pro-rated rebate based on expired % of  1 year term @ $250.
3. Purchase T2 software= $ 100.
4. Purchase VTV software= $ 75
5. Purchase T2 and VTV= $ 150.

This pricing is for current subscribers only.  

Going forward within the next 10 days the Newsletter format will change to approximately 3 times a week, focusing more on research ideas using the T2 and VTV software (and the LM and TAQK models).  Adopting this new format and giving users the opportunity to explore T2 and VTV scenarios of their own design should allow users to gain better control of their investment options while at the same time reducing the wait time for me to update the files and examine the current momentum rankings and RSQ/P6 values.

Each program (T2 and VTV) has 2 tabs...a Data tab where data inputs are loaded and a Results tab where either the T2 or VTV results are tabulated. The Ticker inputs for both programs can be either ETFs or NYSE/NASDAQ stocks and you can load up to 11 inputs in the T2 model and 6 inputs in the VTV model.  Using the T2 model the user can mimic the T6, T9, Lazy Man or any other variations of the T2 strategy. You can select results for top 1,2,3,4,5, etc models without refreshing the Data update.  The momentum rankings are calculated automatically in conjunction with the Data update.
Depending on the chip set spreed of your particular computer the processing time for Results once Data inputs are entered is approximately 15 seconds.

The DB, MRSI and GS2 Alerts are not part of the T2 program since they are generated through TradeStation and there is no functional link between the two programs.  The side panel charts of the components with the RSQ and P6 (updated polynomial 5th degree to 6th degree function) indicators are intended to provide a baseline for creating your own risk control STOP policy.


 T2...
Allows the user to use default portfolio or enter up to any 11 ETFs or NYSE/NASDAQ stocks.  Smaller component portfolios such as the 6 ETF Lazy Man or other models having less than 11 components can be created and analyzed by simply entering only the number of components desired
Provides end of day historical data returns
Includes the same metrics panel as recent newsletter posts
Includes comparative charts of the benchmark and the composite T2 model for 2 years and 6 months
Includes 10 component charts to help analyze price behavior of each component stock or ETF and to gauge appropriate risk control stops based on RSQ and/or P6 (6th degree polynomial) values

What's not included:
Alerts based on DB, MRSI and GS2 TradeStation studies
Automatic stop signals

VTV...
VTV is designed to help identify trading opportunities in QQQ and SH by analyzing the behavior of volatility related ETF/ETNs XIV and VXX as well as the high statistical inverse correlation of QQQ/SH and SPY/TLT.  VTV displays a historical spectrum of the volatility skew as a means to gauge the probability of such trades.  Different target pairs and benchmarks can be entered by the user. VTV uses a momentum algorithm that is faster than the T2 model in respect for the high beta values of XIV and VXX.
Allows the user to use default portfolio or enter up to any 6 ETFs or NYSE/NASDAQ stocks.  Smaller component portfolios such as the 6 ETF Lazy Man or other models having less than 6 components can be created and analyzed by simply entering only the number of components desired
Provides end of day historical data returns
Includes the same metrics panel as recent newsletter posts
Includes comparative charts of the benchmark and the composite VTV model for 6 months in both close up and macro views
Includes 6 component charts to help analyze price behavior of each component stock or ETF and to gauge appropriate risk control stops based on RSQ and/or P6 (6th degree polynomial) values

What's not included:

Automatic stop signals
Metrics performance reporting panel. 
(Sample performance metrics will be posted over the next few weeks to illustrate the types of returns that can be achieved using the model rankings.)

In the near future we also plan to offer the z-score based Pairs trading software so that users can further evaluate trading opportunities in any inversely or positively correlated pair of ETFs orNYSE/NASDAQ stocks .eg. QQQ vs SH, SPY vs. IWM, LOW vs. HD, etc. etc.

I'm also working on a lite version of the LM and TAQK variable allocation models that will distributed to holders of T2 and VTV.  The current issue is that the program contains proprietary add-ins that I cannot redistribute gratis.  In any event, the LM and TAQK (and other versions) will still be posted on a weekly basis.  Since LM and TAQK are intended to be long term investment models and not trading instruments such periodic updates should not compromise the model results.  Changes to RM status-- either Vested or Cash- will still be emailed to subscribers as Alerts.