Thursday, March 31, 2016

Mosaic MOD Looks at TLT 2 Different Ways....03.31.16

Today MOD looks at TLT using 2 completely different sets of pairs..in the first case MOD crosses TLT with the major currency ETFs...in the second example TLT is crossed with the market indices and a couple sector ETFs.  In both cases the net odds are LONG TLT as of Wednesday's close.
What we are looking for is a high degree of linearity in each pair trade as well as a consistent P&L.
The best bets are those signals generated with an AP P&L Status...these are signals where the P&L line is currently above the 6 month RSQ linear regression line and rising.
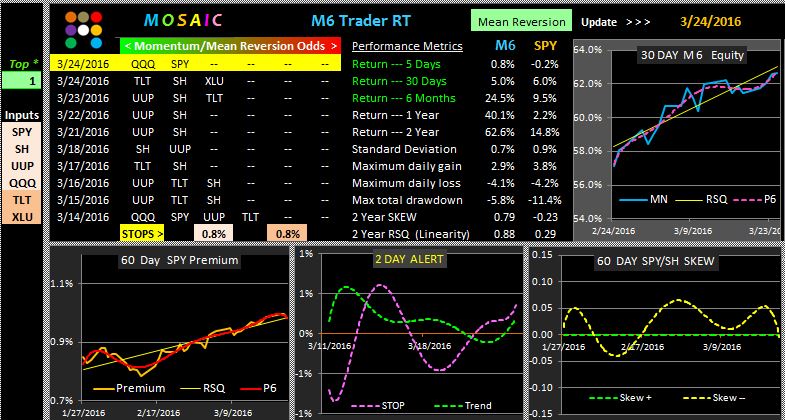
Note that these are results based on a 6 month lookback and no limit stops are applied.
MOD examines potential market momentum (no mean reversion here) based on data-driven z-score studies of volatility standard deviations for each pair.
MOD and M1 analyze the current market milieu using radically different parameters and algorithms and the value of using both platforms in concert is to increase the reliability of single position odds (in this case TLT).  One interesting feature of MOD is that we can quickly create multiple baskets of pair studies to confirm and validate a single positions odds.


Wednesday, March 30, 2016

Mosaic MOD and M11 XLY...03.30.16

Here's a new version of the old PDQ Dashboard...now refined and focused on the SPY (today) and TLT (tomorrow).  Our goal is to get a consensus long/short signal based on a multiple simultaneous analysis of SPY convergent pairs using a z-score analysis of standard deviation "normalcy".
The MOD is essentially neutral going into tomorrow.
At the same time here's an M11 study of the XLY sector SPDR for Consumer Discretionaries using XLY as the benchmark and the top 10 components as the outlier inputs.  M11 users...this is one to keep track of as the short and long term risk/reward results have been very attractive.


Tuesday, March 29, 2016

Ponzo Updates for SPY, VIX and XLE...03.29.16

It was a dull, weak market and then FED chair Yellen chimed in with some dovish comments focused on the struggling job market and the markets took off with a vengeance. It was a low volume melt up and likely to have included a good percentage of short covering so the odds are for at least a modest pullback tomorrow and possibly Thursday and then a strong Friday close per yesterday's odds post..
There are a number of charts setting up double tops and that technical risk has to be considered.
Meanwhile, the SPY/VIX Ponzo updates are net bullish for now while the oil sector (XLE) forecast looks volatile with a short term neutral bias.


Monday, March 28, 2016

M11 Leaders and the VIX Skew.....03.28.16

Here's tonight's M11 Market update...looking to TLT to continue its run.
I've also included a little piece from Barron's Striking Price this weekend on the possible use of the VIX Skew to help decipher likely longer term odds.
At one point today the VIX was up over 8%, charging like a racehorse out of the gate.  Maybe a sign of things to come?

Sunday, March 27, 2016

VDX Updates for SPY, VIX and TLT....03.28.16

This week's VDX updates reveal the pre holiday weakness in the majors and the somewhat marginal recovery of the VIX from oversold levels.   Going forward we'll need to keep a close eye on these charts as the historical trend has been to see advances to at least the zero line once a threshold reversal has started. We are fast approaching the end of the month (Thursday) and then Friday is historically a VERY bullish day. (positive odds > 75%) so for odds players that's the day to go risk off ...or Thursday's close,.. especially of its weak.


Thursday, March 24, 2016

M6 Mean Reversion vs. Momentum..03.24.16

No trading tomorrow in recognition of Good Friday and there was a sizable sell off at the open to set up risk on positions ahead of the 3 day market closure.  That weakness was ultimately resolved to the upside (marginally) as dip buyers gradually emerged in the afternoon.  That is a bullish indication of course but the continued low volume reflects a lack of any real commitment one way or the other. Next week is historically weak but then there/s the end of month bullish odds setup only 7 days away.
Here's a little different market neutral mix using the M6 platform and looking at the mean reversion versus momentum filters the former currently has the clear edge in reliability.
M6 users please note the position of the 2 Day ALERT signal in each mode. That's risk off..
 

Wednesday, March 23, 2016

TLT PONZO and M1 Updates....03.23.16

I should have posted the TLT PONZO update yesterday since it adds to the level of confusion in deciphering data driven market direction forecasts. The newest Ponzo is clearly as bullish as the SPY chart, which is not a realistic scenario, so the end result is more uncertainty and less confidence in the current signals.
Note that the error factor on the best historical fit for TLT is much better than on SPY.
We are most likely in the headwinds of a major market paradigm shift and the best risk/reward odds for that are bearish...which means the mean reversion models that have been lagging may soon evolve into attractive momentum models, at least short term.
Note the rising equity curve and the TrendX upslope. (Updated 7 AM PST today)
Current signal for tomorrow is out but that could easily change by the end of the day.

Tuesday, March 22, 2016

PONZO Updates for SPY and VIX....03.22.16

This week's SPY update presents a dramatically more bullish scenario median than we've seen in months.  The crash scenario has disappeared and the odds look skewed about 80/20 in favor of the bulls.  We shall see. Last week's bearish mean forecast was clearly off the mark (see the previous brackets on the chart) and the current low volume milieu tends to distort underlying sentiment.  Best to say we have a reluctance to buy and a reluctance to sell.
Meanwhile the VIX has also developed a neutral forecast, which is not at all in sync with the bullish SPY outlook.
How this divergence will be resolved remains to be seen but we still believe May could be the time to favor cash this year and only play the highest odds directional setups or a delta neutral stance..


Monday, March 21, 2016

TLT and the Bond Mix....03.21.16

Checking on the technical status of TLT reveals M1 setting up for a buy on the mean reversion mode...which has proven more reliable than the momentum mode. And, following the previous posting of the M11 bond mix here a composite look a the individual bond charts.
Note that all have upslope RSQ lines expect HYG and JNK... the 2 recent high flyers that look to be hitting exhaustion levels.
Here's an eye opener article regarding the assumed safety of bonds....depends on whether you're long or short.  And, just in case you doubted the scale of current market manipulation just note that VIX is currently up 1 % and XIV (the VIX ETN inverse) is up 2%.  I mention this head scratching situation only because one of the respected $1200/year advisory services that I follow advised 100% long VXX this morning (currently down 2%).  Caveat emptor.


Saturday, March 19, 2016

VDX Updates for SPY, VIX and TLT.......03.19.16

We are now technically overbought on SPY and oversold on the VIX and TLT.  Its been a while since we have seen these threshold levels and although we may see additional gains next week they are expected to be minimal and short term.
The VIX is now at 14, a level that few predicted only 2 weeks ago but the DMI+ has yet to turn up. When the DMI + and - do cross its likely to be a strong and sustained move.
If this rally is to go forward QQQ and XLF would be the typical leaders.  Instead, its been the DOW (DIA) and the Russell (IWM) that have been the movers.  Past history patterns demonstrate that when IWM reverses it tends to do so with a vengeance...much more so than either SPY or QQQ, so there's that to consider.


Friday, March 18, 2016

M11 BONDS Update...03.18.16

One interesting market dynamics fact is that bonds have risen almost in sync with equities in the progress of the recent rally.  So, if traders are buying both equities and bonds...what does that mean?
Could be a whole lot of hedging going on as the general analyst consensus is flat to down for the rest of the year.  We've retraced off the recent lows to almost 90% of the previous highs in the majors and seasonal weakness is only 45 days away so its not unreasonable to expect some presumptive risk off positions being put in place..  That's one theory at least.
The M11 BONDS ETF model (which includes 3 equity ETFs  to confirm the direction of market momentum) is shown in both Momentum and Mean Reversion modes.
Both models show attractive linearity and drawdown metrics but its the Momentum model that likely has the best trading opportunities.  This is a top 2 sort and we can see that TLT and TIP have progressed from the far right to the left side ranking in a slow and deliberate manner ...suggesting those issues may be about to technically overtake the current leaders in positive momentum..


Thursday, March 17, 2016

M6 Favors XLU....03.17.16

The rally today (surprising to me) has now pushed SPY into EXTREMELY overbought territory with the RSI2 at 95.  Yes, we could actually push to 208...stranger things have happened....but the low volume recent gains have been climbing over a wall of worry with little regard and tomorrow's option expiration should give us a better indication of how much of the action has been short covering and how much has been real accumulation.
The FED's dovish tone yesterday was ostensibly the catalyst for today's positive reversal but we also saw a number of afternoon reversals that suggest points of weakness that may soon expand to other sectors. Gold and oil have also been screamers recently but the jury is still out on whether a true bottom has been hit or whether the Saudis and other Mid East suppliers are just playing gamesmanship with the market in the short run..
XLU of course is EXTREMELY overbought times 2...but it keeps going up....far beyond technical expectations.  For now its the momentum pivot to keep your eye on..

Wednesday, March 16, 2016

The VIX via VDX, M1 and the CBOE.....03.16.16

Here's the latest VDX and M1 spin on the VIX volatility index.  Keep in mind the M1 results are really only useful in assessing daily risk/reward since the VIX can only be bought/sold in the form of options and futures, which are themselves highly volatile intraday..
Can I just use VXX as a proxy for VIX and achieve similar results you may ask.  The short answer is NO,    which is largely due to the time decaying derivatives that IPATH uses to construct VXX.
With the VIX hitting 15 today at the FED announcement the odds are we're going to see it go up.
Below are a couple tactical approaches to VIX trading thanks to my friends at the CBOE.
(These are examples only of how to set brackets and do NOT reflect current VIX values.)


Tuesday, March 15, 2016

PONZO Updates for SPY, VIX and XLE....03.15.16

Another week and the SPY crash scenario is still with us.  The VIX actually looks less prone to a volatility pop than last week but the risk is still evident.
What's surprising is the status of XLE (SPDR oil sector) which looks very benign in both its short and long term volatility.  If you like butterfly options this is the perfect risk/reward profile you look for....stagnant and narrow range.
The bad news is that SPY has now taken a distinctly bearish tone in the average forecast signal.
We got to our 202 upper resistance (200 day line) and now the markets have stalled.
The likely short term momentum is now down even though current breath signals are positive.
This looks a lot like the precursor signal we saw back in late November and early December when the trend was clearly negative.
The FED will announce sentiment on future rate increases tomorrow and it could get volatile depending on the tone of the minutes.


Monday, March 14, 2016

M11 Market Status...03.14.16

Here's the M11 Market status as of Friday's close looking at both the momentum and mean reversion modes.The 5 day metrics reveal that the momentum mode is weak relative to SPY whereas the mean reversion mode is outperforming SPY, at least short term.
Friday's mean reversion signal did pan out well in today's modest pullback and we'll just have to wait and see whether the short equity side (via bonds) will be sustained as SPY struggles to break through strong overhead resistance at 202.  Volume is VERY LOW today.
This weekend I did post various iterations of the M3 oil/gas model on INSIGHT.


Friday, March 11, 2016

Hedge Fund Trends...03.11.16

The market's roller coaster ride continues with uncertainty still a major factor hampering any real trend development. Here are a couple charts from State Street (I like these guys) showing current sector strength, short interest and relative attractiveness from hedge fund perspectives (they are not always right, just most of the time). This weekend we'll look at the M3 oil model on the Insight tab.

Thursday, March 10, 2016

Red Reversal....03.10.16

The nice pop at today's opening turned into a prime selling opportunity as SPY hit 201 (our overhead resistance target) and sellers stepped in with heavy volume.
Despite the generally positive tone of global economic news the markets are now looking for any excuse to go down so longs are likely to have some rough going for a while.
The current buzz in the risk world concerns finding non-equity and non-fixed income alternatives.
Almost 2 years ago I proposed a number of such mini-portfolios and today I dredge up a simple 3 ETF input model based on oil and gas...XLE, USO and UNG.  A thinking person may immediately conclude that this is a dismal portfolio fraught with risk and you would be right.
However, if we apply our MSD model with the short term momentum mode turned on and a top 2 sort we get the following results.  Note the disparate values of the stops based on an M1 run for each input...there's considerable variance here to reflect the intrinsic volatility in each input.
Over the weekend we'll explore this model in greater detail on Mosaic Insight.

Wednesday, March 9, 2016

Approaching Overhead Resistance....03.09.16

Checking the latest M6 update reveals that XLU is still the risk on choice with SH (SPY inverse) in position #2.  We can expect major resistance at SPY 200 and if we break through that then 202 may prove even more difficult to penetrate.
The new talking heads technical spin (today's version) is that equities will likely fall in sync with oil. That being the working premise the jury is still out on whether the current oil rally really has sustainability or whether its based on hope and manipulation.
Based strictly on a supply and demand argument oil is more likely to go down in price than up.
Below is the current Ponzo forecast for XLE (the SPDR diversified oil sector ETF).
Mauldin's extensive study of the Saudi situation supports this bearish position.


Tuesday, March 8, 2016

Not Out of the Woods Yet...03.08.16

Here's this week's Ponzo updates for SPY, VIX and XLU and the dreadful crash scenario is still evident via the SPY and VIX charts. Barron's this week opined not to get suckered in by the current rally due to both domestic weakness and geopolitical risks.  Mauldin had an interesting post on questionable accounting practices now in vogue....just another example of the rampant manipulation of market data.  Given the current level of market anxiety XLU looks like the best risk/reward profile although it too has an implosion scenario.
Nobody believes the FED will raise rates on the 16th (FED fund rate =0), and with good reason.
Bad news out of China today and a new low in the Japanese yield curve (currently negative) created a global selling blitz that may carry over for a few days.


Monday, March 7, 2016

VDX Updates for SPY, VIX & XLU...03.07.16

This week's VDX updates are in sync with the M1 SPY update posted yesterday.  As expected, we did see some modest deterioration of SPY momentum today and volume appears to be dwindling as well.  Traders are clearly testing overhead resistance and today's action could be termed a draw.
From a strictly technical standpoint the XLU  VDI+/- looks the most bullish of the charts.
Keep in mind these charts reflect Friday's prices and a quick check of today's (Monday) action bears out that XLU was the best bet.
The weakest link in the majors was QQQ while IWM made additional gains.
IWM bulls argue that the Russell's relative lack of exposure to international geopolitical turmoil makes them less likely to retreat when the more globally exposed SPY, QQQ and DIA sustain weakness.  All other factors being equal that argument does make some sense.


Sunday, March 6, 2016

Technical Status of SPY....03.06.16

This is a update of the current SPY technicals using the M1 analytics. The most obvious change in SPY stability is the current best odds stop limit, which has fallen to .5%...a dramatic change from only 3 weeks ago when that value approached .9%.  This change in momentum can best be seen in the ATR and PCL charts and the 2 year long term stop volatility chart.  The leveling off of the of OC chart (open to close) is typical of low to moderate volume positive momentum trends...which is what we are now witnessing.  However, the VIX is now hovering around 16 and the RSI2 is in the high 90s and the odds suggest at least a modest pullback may be on the horizon.
Historically, down January and February conditions have been followed by strong March and April returns but the case is only encouraging for the bulls and not compelling.
Click once on panel below to enlarge.

Thursday, March 3, 2016

Bear Market Rally or Something More?...03.03.16

It was a tenuous start today with technicals solidly red and then buyers slowly came in, bailed out and then ultimately pushed the markets higher.  There's still a number of caveats for the bulls and the squirrelly behavior of XLU, which should be fading if the bulls are in charge, still leaves room for suspicion.  Friday is biased bearish but the talking heads are now suggesting buying the dips rather than selling the rips.  Of course, they've were wrong before so trading small scale is not a bad idea.