Monday, December 30, 2013

Narrow Range Continues...Bullish Signs....12.30.13

Another narrow range day with the DOW up and the S&P and NAZ down.  The M3 Trader says it clearly....all three ETFs have now faded to a no momentum status and have been negated by the algorithm.  What's interesting is the bullish hook that appears to be developing in the 2 day ALERT chart and both of the SPY based pairs charts.
I mentioning some of the factors favoring a short term bullish bias:  end of month, New Years holiday, year end rebalancing and lack of NYAD weakness.  The low volume environment in which all this action is developing makes for a rising risk situation and we saw a 5% pop in the VIX today..perhaps a harbinger of things to come.

Friday, December 27, 2013

VIX On the Move?

The VIX did move up a bit...but 1% is trivial when the VIX can fluctuate 10% or more in a single day almost 15% of trading days.  Nevertheless, it's a start.  The markets remain overbought and, adding to the bull/bear conundrum discussed yesterday, we are now faced with an end of month bullish bias for Monday as well as a pre New Year's day bullish bias.  Who said trading was easy?

The M3 SPY Trader has now kicked XIV out of the top slot and we're back to cash in our SPY account. Keep in mind that the M3 SPY version is basically a volatility momentum trading platform.
When XIV falls out of the top ranking position that signifies waning bullish momentum in SPY...maybe not a reversal, but certainly a reason to pay closer attention to any open positions with an eye towards preserving recent gains.

Note the cross on the 2 day ALERT and the down hook on the equity curve chart.
The model has racked up some decent gains using the AUTOSTOP function to validate trades and we're now in a standby mode...waiting to see if the multiple bullish biases push the markets higher.
If not....we should be prepared for a pullback that may take us back to the SPY TrendX support line....see right side panel....it's long overdue.. and the increasing open interest in the Jan VIX out of the money calls suggests some deep pocketed traders are betting to the short side.
Also note the "A" pair momentum chart (SPY versus XIV).  The skew is fast approaching the zero line...which has been a reliable trend reversal signal in the past.

Thursday, December 26, 2013

VIX Plunges to Extreme Oversold Levels...12.26.13

Another bullish day with the VIX cratering to a mid day low of 11.70 before recovering to close at 12.30.

If you don't follow the VIX you're overlooking one of the most highly regarded (and highly trading) vehicles for gauging market support and resistance levels.
Below are the daily and weekly charts of the VIX for 130 bars and it should be immediately apparent how overbought the markets are.
I've inserted the RSI 3 indicator on the VIX charts and the value at today's close was 10, yes 10.....on a scale of 0-100 so there's basically only one likely direction we can go from here.On the weekly chart the RSI 3 is still at 29 but the odds are now with the bears.

Also note the position of the TrendX in the right panel.  Yup....we back at overhead resistance.
This presents an interesting dilemma since all momentum signals are bullish but the technicals are screaming "be careful, this can't last".

Today's closing action suggests that a few folks are scaling back positions in order to preserve the recent runup gains.


Tuesday, December 24, 2013

Santa Claus Rally ...12.24.13

Another positive day for the markets although the QQQ did close ever so slightly in the red.
A quick look at the TrendX on the right side panel suggests we may still have room to go before a reversal of fortunes..as mentioned yesterday.

Momentum closed near the zero line on the intraday SPY TrendX chart (below) but the SPY Vixen gave us a clear BUY signal all day long (shortened session).

The concern at this point is that the VIX (S&P volatility index) is fast approaching 12 and that typically results in a volatility pop at some point.  It also means that XIV (the VIX inverse) which has been the real money maker in the M3 SPY Trader is in jeopardy of losing momentum and possibly reversing.  While this may not be the time to seek cash it may be prudent to set some money management stops to preserve the capital gains that have accrued over the short term.

Wishing all of you the best Holiday season, regardless of your persuasion, and looking forward to a rewarding 2014.


Monday, December 23, 2013

Melt Up Continues...12.23.13

The markets continue a slow churn up working further into overbought territory and the prospects of at least a moderate pullback although the catalyst for such an event remains elusive...perhaps negative upcoming earnings although the scale has tipped to the upside for most of reporting firms so far.

The SPY momentum remains upslope and will likely remain so for the remainder of the week, which is typically very low volume so that the small traders can cause ripples in intraday momentum not typically seen.

The models are cautiously bullish until the reversal kicks in.
QQQ is showing unusual strength along with the financials (XLF) and I have commented many times before on the bullish implications of this ranking.

Thursday, December 19, 2013

Momentum Pause is Bullish...12.19.13

The markets took a little rest after yesterday pop and going into Friday option expiration the technicals are marginally bullish.  Tomorrow we commence the year end period that is known as the "Santa Claus Rally" due to the statistically strong momentum demonstrated in this time window over the past 25 years.  Yes, there have been years when this expectation was stunningly wrong but for multiple reasons the bulls have about an 8 to 5 edge for the next 2 weeks.

Looking at the M3 SPY Trader the signals are bullish.
The SPY TrendX closed the day on the zero line (neutral) so the net result is positive.

I've turned on the AUTO STOP feature on the latest M3 sort just to filter out the positions invalidated by the program.  And yes, the program was bullish on the 17th going into the 18th. 
The decision to adopt a cash stance was strictly discretionary on my part.
Sometimes M3 knows best.

Wednesday, December 18, 2013

FED Drama Pivots to the Upside....12.18.13

The FED decision to reduce monthly buying by $10 billion was met with an instant drop in the DOW of 60 points and then the markets decided it was actually good news and the indices all roared upward for the rest of the day and into the close, ending with new highs in the DOW and SPY.

I was expecting volatility today but this was more than most folks imagined.
AND, yes, it was a missed opportunity cost by being in cash today but there are always opportunities in the markets and our goal is a slow steady rise in equity without the high time sweats produced by worries about capital loss.

Today's action was a picture perfect bounce off SPY support levels...see TrendX chart on right...
Is it time to chase these new highs?  Tonight's update of the SPY Trader show that once again XIV has gained the upper hand which is usually a signal of continued momentum, at least short term.

Tuesday, December 17, 2013

Expect Volatility Ahead...12.17.13

The expected downswing continued throughout the day ahead to tomorrow's FED buzz. The DOW managed to eke out a few minutes of green time but ultimately all the majors closed in the red.
The SPY closed just slightly below the zero line (neutral). although the VIXEN was bearish for the last 45 minutes of the day.
Note the SPY TrendX chart on the right>>>>> we're back to support levels following Friday's pop.

In the lower SPY Trader charts the XIV actually rose into the end of the day...which is bullish in the face of tomorrow's high risk environment....and a bit of a surprise given the negative tone of the day.

A highly respected market tactician predicted that 2014 may see up to a 16% decline even in the face of apparently improving economic prospects.  Of course this is just one guy's spin but his argument does bear some thought.

Best of luck to everyone tomorrow.  The Mosaic models are all in cash until the dust settles.

Monday, December 16, 2013

A Tenuous Bounce...12.16.13

The majors were up in the pre market session and held on respectable gains throughout the day, bouncing off of Friday's TrendX support line and finishing the day just slightly below the TrendX zero line.
Note volatility is climbing also (XIV down = VIX up) at the same time that SPY is rising.
This unusual situation can probably be traced to the high expectations for the FED's Wednesday pronouncement on the near term prospects of the FED tapering off its current $ 85 billion/month buying program of mortgage backed securities.
Wednesday is widely expected to be a major pivot point in market momentum and will likely set the tone for at least several weeks going forward. It could provide the catylst for the 5-8% decline that many market gurus are forecasting...or it could spark a blowout Santa Claus rally to the upside.  Which ever way the markets swing it promises to be exciting.

Friday, December 13, 2013

Fun with M3...12.13.13

It's Friday the 13th in 2013 but the markets are actually showing some positivity (made up word).
We're seeing tenuous strength at best as traders await the supposedly watershed FED pronouncement next week of a possible tapering schedule. Rest assured there will be dips and turns in the market along the way as that day approaches.

In the meantime I thought it would be fun to construct a couple more test M3 models in the spirit of yesterdays petro setup.

First, let's look at how a simple model of SPY, AMZN (Amazon) and FB (Facebook) would have turned out>>>>>
That's a pretty simple model and if you actually look at the daily charts its clear that FB was the engine that really drove the returns....and continues to do so.

Now let's add AAPL (APPLE) to the mix as a benchmark.  Still the darling of the tech world AAPL represents about 20% of the capitalization of the NASADQ100 index so it is the 800 pound gorilla that MSFT used to be (long time ago) and its price action can still cause a visible ripple in the QQQ's when it moves.
In this case we've used a top 2 sort to try and hedge the AAPL risk profile.  The results speak for themselves.  The model beats AAPL's returns and with a lower risk exposure by almost 50%.

These little vignette type setups using the M3 can be extremely useful in more closely examining the momentum and relative strength of a specified "benchmark" ETF or stock and we could construct many other setups with this risk mitigation goal in mind... but, for now, I leave that to my readers to explore on their own.

Thursday, December 12, 2013

TrendX Approaches Support Level..12.12.13

Another triple digit down day has put the SPY close to mid term support levels.....see Trendx panel at the right>>>>>>>. That's the hopeful view

On the dismal side ..once again the international stocks EEM and EFA got battered although EWJ (Japan) managed to eek out a small gain and bears keeping a eye on as a potential mover.  We're seeing a number of index ETFs and stocks in a roll over pattern...which is typically a harbinger of more downside to come and I reiterate my observation yesterday that the NYAD still has no sign of a capitulation ...with the expectation of values below .10 before a meaningful bottom.

So what's a guy (or gal) to do when the market teeters?
In a conference call today with a client we discussed the outlook for oil and gas and associated ETFs.  Since I'm not a registered investment advisor I can't legally recommend issues to buy or sell so I'll simply display what I showed to the client...a variation of the M3 SPY Trader using UNG (natural gas) and USO (US Oil Fund) in lieu of XIV and SSO. 
You could also use XLE for the benchmark to get a clearer view of the petro sector performance.

The results are pretty interesting and reflect our ideal trading plan....a continued sequential alignment of the rankings..hence few trades and a nice linear equity curve.
Here's a surprise...there's a number of these nugget setups out there ...you just have to find them.
This also demonstrates the efficiency of the M3 platform...you're either vested or in cash without a very small portfolio (3 issues to manage).
Current Mosaic users still have the opportunity to purchase the new M3 platform at a reduced rate.


Wednesday, December 11, 2013

Down Day...12.11.13

The Small World 2 Day ALERT noted yesterday caught the turn although there was an opportunity to bail at the open. In fact some of the greatest weakness today was booked in EEM and EFA along with EWJ and EWG, perhaps revealing how fragile the current market situation really is.
It was a bad to worse scenario all day although volume remains muted and the NYAD (advance/decline line) only fell to .23 levels...well above the capitulation levels of less than .10 than we normally see before a positive momentum reversal.
Here's a look at the SPY X sectors:
Consumer staples was the only ETF in the green and it was a marginal gain at best.
The SPY Trader was negative from the get go and this is what a full bear event looks like on the charts:
On the lower chart XLU finally shows its role as a risk hedge.

Tuesday, December 10, 2013

Momentum Becomes Elusive...12.10.13

Yesterday we looked at the VEGA bullish model profile and today here's the current view of the Small World portfolio.  Both are characterized by waning momentum and today's decline in many of the tech big names (not to be confused with the internet big names) is a cause for some concern although volume continues to be muted so the bulls may yet regain the lead.
The best looking profile here is probably EWJ (Japan), sharing a low put/call ratio with VGK but enhanced by a number of market forecasters today who predicted that Japan's economy is poised to kick into high gear next year.  The same forecasters predicted that the European markets would do well (VGK), although to a lesser degree and with more risk factors to deal with.

Note the general decline in volume today (volume buzz column)....as well as the positive gain in EWJ (and EEM..emerging markets, which has been trying to get in  breakout mode lately, but which has delivered mostly stop and go momentum with no clear trend defined ).

Small World has booked some nice gains recently but the STOP line is dead on the trend line intersection so cash will be our position if equity weakness develops tomorrow.

Monday, December 9, 2013

Markets Flat with Hidden Momentum.. 12.9.13

We missed the Friday pop...that's the bottom line.  It's hard to see those types of news events coming using either fundamental or technical analysis.  Had the jobs report been less than stellar the results would probably have been just the opposite.  As it was, many of those jobs may be seasonal hires with the next jobs report showing less momentum,  Not trying to be pessimistic... just trying to separate reality from hype.  Friday's rise was uber low volume, which actually argues against it being a short covering event although short interest in the majors is still balanced in favor of the bears,
The momentum at today's start looked like we were headed higher into the close but the final hour pulled most of the indices back to the neutral line. There are pockets of strength evident however, including tech and the financials, which, as we have mentioned before, is usallly the 1,2 lineup that drives the markets higher.  We are entering the seasonally strong time of the year as fund managers add positions of the years top gainers before year end to show that they too were holding winners.
Note that XLU (utilities) was the loser today on the VEGA bullish model.  This is a bullish sign.

Friday, December 6, 2013

How to be Short While Being Long..12,6.13

Markets are reacting positively to the jobs numbers but its the season for temp worker surges, so there may be a little false sense of hope and underlying concerns about FED tapering are still lurking in the background.  For now the DOW remains below the 16,000 resistance level and the close today should serve as a tellatle for next week's likely direction. A closer examination of the technicals shows we're still in a short term downtrend so we need to be cautious going Long at this point.

Several readers want to know how to deal with the possibility of a sustained downtrend in the markets but don't want to assume short positions and don't want to be in cash.
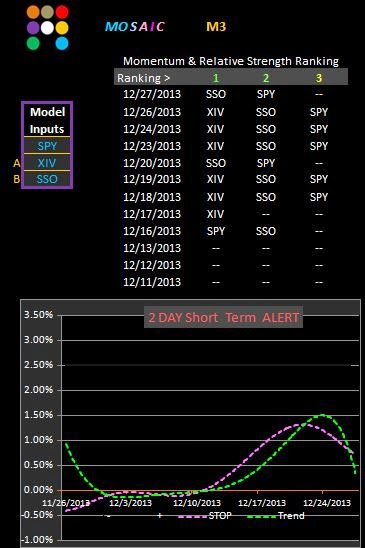
There are a couple ways to solve that problem and the new M3 SPY Trader was actually designed with that purpose in mind.  It's instructive to run a couple of these setups on a daily basis...not necessarily to trade them, but simply to see how M3 is analyzing the momentum rankings.

First, the SPY, SDS, VIX setup.  SDS is the ultra short (x2) SPY and VIX is the S&P volatility index.
The yahoo symbol for VIX is ^VIX (that's the shift position #6 key).  The results are breathtaking (as is the risk profile BUT THE PROBLEM IS YOU CAN"T ACTUALLY TRADE THE VIX.  Sorry, but the VIX is an index and the only way to trade the VIX is using options, which have a decay function and a volatility all their own that can swing wildly both daily and intraday.  Nevertheless, the model results do reveal Long/short momentum divergence.
Next we'll look at a variation of this theme using SPY, SDS and VXX (the VIX short term ETN)
ETNs are different than ETFs in that they are based on a basket of futures and tend to exhibit an unavoidable decay factor that makes them suitable only for short term trading (2 weeks or less).
I've turned on the AUTO STOP function that I mentioned yesterday as it helps to clarify the situation.
 We get a different risk profile than using the VIX but the VXX is actually tradable on any platform and so the linearity of volatility is considerably improved.
Finally, we'll look at a moderate setup of SPY, SH (SPY Inverse) and SHY (short term bonds, which effectively serve as a proxy for cash).
This is really a market neutral model where we are looking to see which side of the bull/bear momentum is currently leading.
Once again I've turned on the AUTO STOP function to better see the risk situation.
Once again, while we may not choose to trade these setups they are useful in determining when trends are reaching exhaustion levels and new trends are emerging.  And, as always, proper application of the risk management signals can improve the net returns of these examples significantly.

Thursday, December 5, 2013

MSFT Trap Door Opens...12.5.13

The situation with Microsoft today demonstrates what can happen when trader sentiment changes.

Events like this are scary if you happen to be long because you never know if there might be another leg (or 2) down.  These are big volume situations and may blow right through stops placed with your broker.

There were 2 user queries about easy ways to gauge volatility and I suggest checking in with the new
VIXEN site as one way to see intraday flux.  These charts are fractal, meaning you can set them up for any time frame...you just need to set up an account with freestockcharts.com.
Here's today's morning view of SPY and XLE:
For new users of the SPY Trader platform there's an embedded risk stop that may be helpful in judging the appropriateness of CASH versus vested positions.
First..go to the Calculations tab
Then click once on the Auto Stop box
Return to the Data tab and RUN ALL MACROS.  The results will be a new Ranking arrangement with positions that have violated the short term ALERT status replaced with --...meaning no position.

Just be sure to run back to the Calculation tab, unclick the Auto Stop box, and RUN ALL MACROS again to return to the default rankings.
Meanwhile here are the results from last night's AUTO STOP run with a top 2 sort: