Tuesday, July 31, 2012

AIW 7.31.12

This is a model using AAPL, IBM and WMT in lieu of QQQ for the equity side of the balance and the results are pretty impressive, especially the max drawdowns.  I mentioned a few posts back that we'd focus on increasing forward looking returns while paying less attention to past performance but this model shines in both areas. 
Note that new capital risk exposure is currently in a HOLD position.
As usual there are a couple caveats here, as hinted at by the NAV chart above, but to achieve these levels of risk buffered appreciation you either have to have abiding optimism in tech or be prepared to trade the risk managed model to truly insulate the portfolio.
In future posts we'll examine some of the reasons why this may or may not be a good model to accomplish your portfolio goals.

Monday, July 30, 2012

Yield Makes a Difference

One of the metrics that Mosaic models focus on is distribution yield, or the dividend payouts either monthly (most bond ETFs) or quarterly (most stock based ETFs).  As uncertainty in the market rises the common investor behavior is to gravitate towards the higher yield instruments (typically bonds).  The caveat is that some of these bond funds have demonstrated ugly reversal patterns when rallies develop so some due diligence is necessary before picking longer term risk offsets to the equity side of the equation.
The GE yield surprises many investors and is an attractive feature for longer term investors.  On the shorter term GE has an ATR8 of $ .41 or a daily 2% range averaged over 8 days.  That's pretty volatile and also surprisingly consistent.  GE typically trades 25% more volume than QQQ on a daily basis and I've mentioned before the emphasis that several prop trading shops focus on it. Making GE work effectively as part of a Mosaic model is a work in progress.
Next month we look at a couple "off the wall"  Mosaic models that contain GE and a few other surprise stocks in lieu of ETFs just to see some options for offsetting risk while still delivering a respectable capital appreciation.

Saturday, July 28, 2012

S 7.28.12 Weekend Update


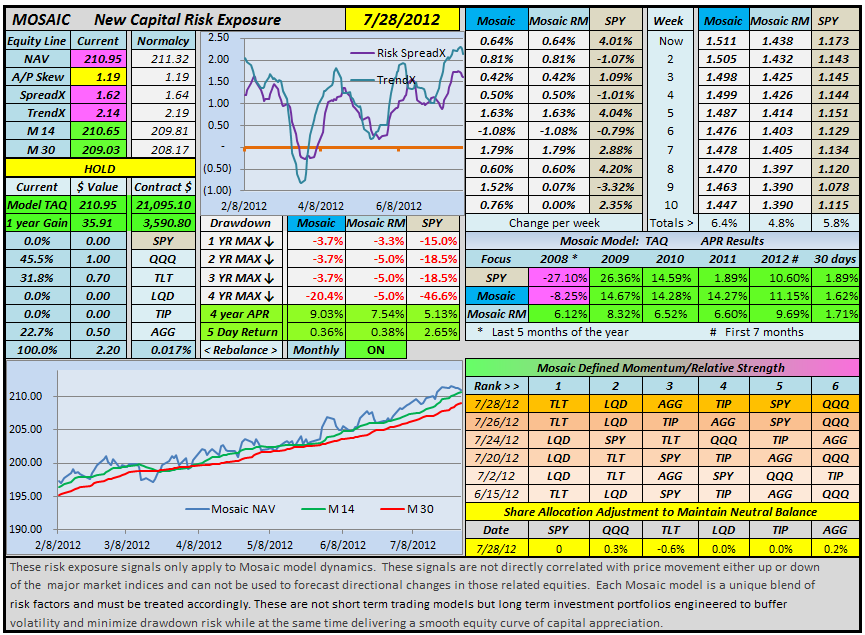
We're sticking with the TAQ model for now...just 3 components but the equity curve continues to provide the defensive posture that is our goal.  Both the SpreadX and TrendX have turned negative so the HOLD recommendation for new capital remains in effect. 
The SPY made huge gains the last 3 days of last week, turning the previous 5 day return results on its head.
On the other hand, the 30 day performance metrics are holding strong.
It's a bit surprising that the Mosaic Ranking of Momentum/RS is still heavily skewed to the bond side but that could turn out to be a precocious signal if things turn sour next week.
Although LQD and TIP are not in the current model we are keeping them in the Ranking matrix in order to monitor their price pattern and re-evaluate their utility in rejoining the model.
Monthly rebalancing is coming up but we're recommending delaying that until August 6th to pickup the dividend. We've mentioned this nuance before and more details will be supplied next week regarding the yield capture issue.
The relative flux tracking of Mosaic and SPY shows how well the model has maintained neutrality while the SPY has spiked wildly recently.  It really all about the news, which continues to give mixed signals about the likely prospects for the future, but our model is effectively shielded from the need to successfully forecast market direction.
A quick look at the TLT VIXEN in the right hand side bar hints that the bulls may be gaining an edge and with the end of the month (typically bullish) the odds are stacked that way...which savvy traders know counts for absolutely nothing.
A new TLT VIXEN signal doesn't kick in until we get a cross of the VIXEN pivot (yellow line) and that still looks a ways off.   
We'll look at the MRSI Situations updates on Monday.

Thursday, July 26, 2012

TAQ 7.26.12

We're temporarily adopting a new model with only 3 components.  The LQD and TIP have reached extreme overbought levels and their usefulness in providing proportional risk offset needs to be re-evaluated.  The TAQ model, like the demonstration S model, remains in a hold mode for new capital.
Our goal is to focus attention on improved net returns (and the safety net) for the rest of the year rather than what's happened in the past.
We'll examine some portfolio options for accomplishing that goal on Saturday.

Wednesday, July 25, 2012

A 100% SPY Mosaic - Not Recommended


This is a little study to see how much risk management the Mosaic RM filter produces.  Note that in this case the entire Mosaic portfolio is just 1 ETF ...SPY... 100%, so Mosaic=SPY.  The Max Drawdown #s are the focus of my attention and it reveals that the RM filter cuts drawdown essentially in half throughout the 4 year exam period.  Also note the downtrend of the SpreadX and TrendX signal for the SPY and the NAV chart.  Alert readers will notice that if we had sold SPY when the SpreadX & TrendX crossed down through the zero line around 4/9 and stayed in cash until 6/15 when the zero line was crossed to the upside we could have avoided a $4.90/share drawdown in the SPY.  Although not designed to forecast SPY or other market indices, this little XX signal may have some unintended usefulness and we'll publish a snapshot of this signal along with the weekend update.

Tuesday, July 24, 2012

S. 7.24.12 Lite

The model continues to track above SPY and the 5 Day Return line shows the risk neutral allocations have kept us relatively safe.  The RM version is ON but all models are in a HOLD mode for new capital.
Drawdown metrics have been added for the past 4 years and its interesting how each model (and the SPY) have maintained such consistent drawdowns in 3 of the 4 years examined.
SpreadX and TrendX are diverging again so waiting until they move in concert is the first criterion for any new capital.  With the end of the month approaching the equity markets typically exhibit bullish behavior around the last to first days of the month,  That fact doesn't really concern us although we do need to pay attention to ex-div days for the bond ETFs and avoid any negative rebalancing during to holder of record requirement period.  For smaller accounts this is a not a significant $ amount, but for 100K and above accounts those few bucks add up over time.  The projected adjustment is currently negative for TLT but things can change quickly and we'll keep a close eye on the rebalance numbers to play it tactically.

Monday, July 23, 2012

S 7.23.12 Lite

Mosaic subscribers have been alerted that the S portfolio allocations have adjusted as of today's Open and one ETF has been cut to 0% at least for the short term. We continue to refine the graphics and data fields based on user input and the final version of the Newsletter is expected Thursday.
The S model is in a HOLD mode based on impending tops in the SpreadX and TrendX and the current top in the NAV equity curve.  The RM (Risk Managed) version remains ON.
The new allocations were designed to enhance returns of the basic Mosaic model.  In coming weeks our attention will focus on enhancing the RM model returns.
These are really studies in risk aversion engineering using a semi-fixed portfolio....designed to minimize transaction costs and maintenance anxiety and still deliver an S&P500 or better APR...without the drawdown.

Saturday, July 21, 2012

S 7.21.12

We're now in a HOLD mode until we see how the SpreadX and TrendX resolve.  Technically we're in an overbought position for the portfolio and the best course of action is to wait and see if a better entry sets up.  AGAIN....these indicators do not relate to the larger market indices, but are programmed to deliver signals for new capital infusions into the portfolio.  On a 5 day basis both S and the RM version are running ahead of SPY, reflecting their risk control skills. 
On the ranking scale bonds have moved back to slots 1 and 2, indicating the need for a "risk on" approach to the major markets.  Meanwhile the RM model maintains ON, showing the model momentum is continuing to accelerate while the SPY falters.  the right hand charts, especially the top short term version illustrate the different in performance.  The flat portion of the RM (red line) chart reflects periods when RM was in an OUT mode and the portfolio was in cash.  Note what happened to the SPY during this same period.  We didn't lose much opportunity cost in the process and if the equity markets had tanked at that point cash was the place to be.
Monday we'll make some portfolio adjustments that should insulate the portfolio even further against drawdown risk and later in the week the TradeStation performance reports will be available for the Delta Band system (via email request.)

Wednesday, July 18, 2012

S 7.18.12 Lite

The model continues in ACCUMULATE mode.  As mentioned on the blog, today's unique situation where both bonds and equities was both unusual and welcome as we booked gains in all 5 components.  Over the weekend we anticipate some portfolio allocation adjustments, reflecting the extreme MRSI readings in the bond components.

Tuesday, July 17, 2012

S 7.17.12 Lite

Mosaic is in an ACCUMULATE mode as the bond-centric portfolio is still firing.  45 minutes to the close and there's moderate fade-down today's pop following the FED news that Ben's worried.  The last 5 day's metric has changed significantly today....all due to today's down/up turnaround.  Both SpreadX and TrendX remain in sync although a TrendX rollover looks imminent, which will put us back into a HOLD pattern.

NOTE:  We booked 2.5% gain on the closed TLT trade and these little nuggets help to build our equity but are not reflected in the posted performance metrics of the model as they are discretionary and independent of the model dynamics.

Monday, July 16, 2012

Situations 7.16.12


 The Situation Update as of 10:30 pst is showing extreme overbought readings in all the bonds in the MRSI matrix.  These are typically reversals levels but per today's blog post note that there may be more room to run.  The MRSI module has just triggered LONG signals in the Qs and SPY, which are designed to be executed at the end of the day.  It's premature to enter right now...we need to confirm the signals are holding EOD.
20 minutes before the close and the NYAD has been deteriorating for the last hour.  Market volume is thin (ca. 50% normalcy) on the indices as a sideline positions build.  Looking for the Big Break after today's .70 range day.
Recommend delaying entry on MRSI signal Longs until we have better confirmation such as a bullish XLF.

The VIXEN module has no new signals as the equity/bond skew remains intact.

Wednesday, July 11, 2012

Mosaic S 7.10.12

We're seeing something that has not occurred previously and that is a distinct divergence of the TrendX and the SpreadX.  The model continues to outperform SPY and the equity line is above both M14 and M30 but any new infusions of capital should be delayed until the TrendX and SpreadX get back in alignment and are up slope.
Note: the Rank>> line top 4 are all bonds with TLT in the top slot.  Also note the TLT Vixen in the sidebar.

Monday, July 9, 2012

Template Overview

Features:
1.   Current status of portfolio performance using the Mosaic panel of indicators to identify relative  robustness of the aggregate portfolio model.  The solid bar signals the current consensus recommendation of either HOLD or ACCUMULATE for new capital infusion.
2.   The SpreadX / TrendX chart provides an instant profile of whether the portfolio is moving to a "risk on" or risk "off" mode.
3.   Table profiles the % weekly change in Mosaic vs RM version vs SPY.  This is quick snapshot of how well the model is performing relative to SPY.
4.   The Allocations matrix defines the specific % capital allocated to each model component.  The numeric column reflects a portfolio sizing factor.
5.   Defines the maximum equity drawdown over the course of 4 years.
6.   APR - Annual Percentage Return - details the model vs SPY returns each year over 4 years as well as the total average return for that period.
7.   Charts the 6 month behavior of the portfolio equity curve using actual dollars.  The M14 and M30 provide a baseline to assess equity performance.  
8.   Model components are ranked for momentum and RS relative strength in multiple time frames to help determine tactical allocation adjustments.
9.   Indicates the actual percentage adjustments to each position to be executed monthly in order maintain a true balance of the allocations.
10. Charts the 6 month % gain or loss of equity in Mosaic vs SPY.
11. The FLUX chart examines the % daily range in equity in Mosaic vs SPY are reflects the efficiency of the current market neutral balance.
12. Short Term snapshot of equity returns for Mosaic models vs SPY.
13. Indicates status of the Mosaic RM model. ON indicates the model has an equity position. OUT indicates the model is in cash.   
14. 1000 day relative performance chart for Mosaic, Mosaic RM and SPY

Setting Up a Portfolio


VIXEN Terms and Acronyms


MRSI Terms and Acronyms


Mosaic Terms, Acronyms and Indicators


Wednesday, July 4, 2012

Mosaic Launches

The Mosaic platform and newsletter have finally launched.  More details on the Mosaic concept and the accompanying newsletter can be found here.   The Mosaic project has been 2 years in development and offers a market neutral approach to portfolio risk management designed to produce a steady and reliable equity curve.
Mosaic also includes a SITUATIONS companion platform that uses a dynamic momentum rotational model to highlight both long and short term opportunities for ETF and option traders.
Please take a look at Mosaic's various features... you may find something you like.