Wednesday, April 30, 2014

Coiling Continues...4.30.14

The last trading day of the month was punctuated with ho-hum volatility (XIV was net flat) and marginal gains in the major indices (once again).  We're basically in the same technical boat as at yesterday's close so the odds for a big move are now even more probable.


Tuesday, April 29, 2014

Market Coils for Break...4.29.14

The big winner today was XIV ...the rest of the market was relatively benign and ultimately ended only marginally up.  The potential for a big move that holds is increasing as the end of week approaches.
M3 likes the odds for tomorrow on XIV based on today's closing lineup and the XIV led ranking.

Monday, April 28, 2014

Choppy Trading..4.28.14

The real time SPY VIXEN in the right side panel shows today's dynamics.  Depending on the time of day we were various;y in the red or green...with a bullish surge into the close.
These days are daytraders' dreams....you've just got to be watching the screen all day and following the VIXEN crosses.
We'll still got a couple days until the end of the month and last week I suggested weakness ahead of an end of month surge so it will be interesting to see how the market plays out. What's different about April is that the last day of April and the first day of May occur in the same trading week...the first time this year such continuity has transpired...thereby relieving traders from over the weekend anxiety for the end of month/first of month bullish setup...another reason I'm watching the next few days with particular interest.....it might be a doozy.

Saturday, April 26, 2014

Volatility Pop...4.26.14

Bad earnings in big name tech reversed the tentative strength we witnessed on Wednesday.
Our short term M3 ALERT fired on the 23rd and kept us in cash for Friday's swoon, thereby avoiding some nasty drawdown.
The current M3 signal has VXX in # 1 slot...a bearish indicator considering the AUTO STOP feature is turned on ...meaning VXX has gradually been building positive momentum for the past 3 days.

Despite the market crunch and recent lateral action the VEGA model (below) has been able to hold its gains and maintain an upslope equity curve.  Recent disclosures about huge inventories of US crude may make an impending reversal of XLE more likely but the energy giants are hard to trade against.


Thursday, April 24, 2014

Not as Green as It Looks....4.24.14

Thank APPLE and FB for today's bump in the Qs.  Otherwise it would have been close to a net neutral day. We're kind of in the momentum doldrums here as earnings season closes, with the bulk of reports at or above analysts' estimates (for what ever that's worth) and now the market's in search of the next catalyst.  Oil continues to make new highs and utilities and bonds continue to surge.
We're still of the opinion that next week may offer better entry opportunities than Friday.

Wednesday, April 23, 2014

Momentum Fades...4.23.14

The SPY Vixen says it all....choppy and weak following 6 up days.
Turns out the M3 short term ALERT was correct,,,cash was the place to be.
XIV took a big hit and then recovered by the close as XLE and XLU held up well and in conjunction with suspicions posted in yesterday's link.
We may get a follow through on weakness as a setup for a first of the month run up...or???
And APPLE announced a 7:1 stock split today and an enhanced stock buyback program, possibly in an effort to stimulate retail activity.

EEM was particularly weak today and the emerging markets recent strong run may be doomed for a while pending a reversal down to previous support levels.

Tuesday, April 22, 2014

Approaching Overbought...4.22.14

Another green day although we had a significant fade down into the close.  And, looking at the TrendX chart in the side panel, overbought levels are fast approaching.  This cautionary note is reinforced by the position of the M3 short term ALERT.  The last time a STOP fired was April 3rd...right on target for the M3 downturn.
XLE was actually in the red for a while today although the bears are going to have a tough fight on this one if the attached article is any indication.

Monday, April 21, 2014

Lift Continues...4.21.14

After an iffy opening and a retest of the lows an hour in the markets picked up traction and ultimately closed modestly higher.
 XLE (see VEGA below) continues its juggernaut run and prices at the pumps reflect its unbridled exuberance.  The Qs also pickup up some momentum although the financials continue to lag....so not the 1,2 punch we like to see
Nevertheless, the short term signs are bullish...XIV is leading the M3 pack and at least on the surface we're going up. 
From a tactical standpoint there may be a pullback before the end of the month when we typically see a multiday pop and then we'll see how the Sell in May play sets up.


Sunday, April 20, 2014

Weekend Wrap....4.20.14

A positive close on Thursday but the risk adverse were clearly hedging their bets into the long weekend. 
The Qs continue to underperform SPY as can be seen from the M3 reports below.
XIV is ranked #1 in both cases suggesting a short volatility strategy for now although the SPY short term ALERT appears to be reversing.
Meanwhile, the Small World model has gone back into vested mode as EEM has once again turned positive (tentatively).   .
The next couple weeks should be interesting as traders consider a recent spate of articles on the old Sell in May adage, which has actually been a wise strategy on a long term basis (eg. > 20 years).

Wednesday, April 16, 2014

XIV Breakout...4.15.14

The VIX plunged and XIV soared....a breakout day for bullish indicators and a possible sign of things to come.  The lateral consolidation pattern still prevails in many sectors although energy (XLE) is hitting new highs each day and prices at the gas pumps reflect it.  Although crude inventories are up the sudden shutdown of 2 major California refineries has been blamed for the bump at the pumps although the timing of the shutdowns has been questioned by a number of market analysts who have stated that more likely than not its just the usual gouging by the oil majors...all without recourse.
Tomorrow may prove to be the acid test for this rally's validity ....with a 3 day weekend ahead the risk adverse will be selling into improved prices so the close should be watched closely.

Tuesday, April 15, 2014

See Saw Day...4.15.14

Good day for tech, not so good for a variety of other sectors midday but a late day resurgence of buying improved the outlook for Wednesday.  We have a shortened trading week (good Friday), which happens to coincide with April options expiration so expect increased volatility as we approach Thursday's close and the deadline for rollovers and covers.
We're still net downtrend.

Monday, April 14, 2014

Small World Model Update.....4.14.14

While the US equities markets have been under pressure the SMALL WORLD model has managed to hold its own and then some by remaining vested in EEM (emerging markets) and VGK and EWG.
While the returns are not wildly exciting the fact that the model managed to outperform SPY and keep on the right side of the equity curve highlights the advantages of using a multi-model approach for capital allocation and risk management.

Note that on April 10th the Short Term Alert flashed a cash signal.
The equity curve RSQ/P6 and the %  change pair study (SPY/EEM) both indicated a reversal in EEM"s trend was likely on April 8th.

Saturday, April 12, 2014

Selling Pressure Persists...4.12.14

Thursday selling theme was repeated on Friday with QQQ and XLF leading the charge down (see VEGA below)....the exact opposite of what a bullish momentum model should look like.  Some of the big momentum movers are taking heavy hits while many of the large cap "value" stocks are actually remaining relatively strong...that's a good sign.
We still haven't seen any suggestion of a selling climax via the NYAD although the VIX has been in a steady grind up.
Typically we can see the next likely support level, but with selling pressure still building momentum, we need to be wary of a possible new support/resistance paradigm that could drop the markets another 10% before a bottoming pattern sets in.  That's not to say that such a scenario is expected, but simply to point out its possible.
Looking at Friday's run of the M6 Gamma model helps to show the relative weakness of the QQQs....surprisingly the Qs are weaker than the SPY ultra SSO....that's weak.
And, even with 3 bond components in the Gamma mix, the model is in cash having violated the Short Term ALERT cross.  

Thursday, April 10, 2014

Now the Trap Door Opens....4.10.14

WOW!!  That was a nasty day with a complete reversal of Wednesday's strength and to drop to lows below Monday. Blog traffic suggests new fears above earnings but nobody seemed to care yesterday afternoon so the underlying factors for the collapse (and that's what it was) are still elusive. 
NYAD fell to the low .30s level and the VIX climbed 15% intraday...emphasizing the extent of the selling.
Today's reversal will no doubt dampen enthusiasm for another near term rally...nobody likes to be burned twice and buyers at yesterdays highs will likely be looking to recoup their losses at the earliest opportunity.
QQQ and XLF were 2 of the biggest losers today but even the utilities (XLU) got hit.
Treasury bonds were the big winner on the GAMMA model. (not shown)

Wednesday, April 9, 2014

Bullish Signals Fire.....4.9.14

After a tentative pop at the open the markets roared forth in the afternoon session with a classic XIV..SSO...SPY alignment.  XLV and XLF were noticeable for their strength in VEGA.
The only missing element was above normal volume but that may change in Thursday's action if the rally is able to maintain traction. 
AA's earnings report was better than consensus estimates and that likely added an optimistic factor for other upcoming earnings.
The SPY TrendX in the right side panel is now upslope and M3 is flashing the bullish ranking noted above as of today's open.


Tuesday, April 8, 2014

Tentative Rebound...4.8.14

No trap door evident today and although SPY, QQQ and DIA all closed in the green the bounce wasn't exactly convincing. The Qs were the biggest gainer...reasonable considering the index has fallen almost 5% in the past 3 sessions and were technically oversold.
The bounce wasn't shared by all sectors, which is a risk factor for now... while some of the instability in the markets may be linked to earnings season which kicks off tonight with AA.
Trader blog traffic is mostly negative on earnings for this quarter with a common argument that massive technology uplifts in many companies have accomplished as much as possible in productivity and hence profits and EPS are most likely to be flat rather than accelerating in many cases.
We shall see.
For now we remain in cash in the SPY M3 Trader.
Note the Gamma model below using an all in top 6 sorting....the rankings are not used, the portfolio is just rebalanced each week.


Add caption


Monday, April 7, 2014

Watch for Trap Door...4.7.14

Another red day, as expected.  Regarding Saturday's post, the NYAD is still a long way from capitulation levels in the low teens or <.... it closed at .37 
The Qs made an early rally attempt but then went into a slow decline for the rest of the day with a late afternoon rally fizzle.
Generally speaking, when a major stock or ETF is in a downtrend and price hits a new low early in the day ..that low will be revisited (or penetrated) sometime in the remainder of the trading day.  That was the Q's story today.
In fact, the early low of 85.56 turned out to be the closing price although price did crumble below the S1 pivot in the afternoon session.

The thing to watch out for now is the dreaded Trap Door....wherein price appears to be on a rally and then suddenly reverses to the downside.  Such an event would likely usher in a sub teen level NYAD and POSSIBLY provide a capitulation level buying opportunity....but not for the risk adverse trader.
For now the downtrend continues at a measured pace with the internationals ( EFA) and the emerging markets (EEM) showing some surprising strength.


Saturday, April 5, 2014

QQQ Plunges....4.5.14

A really bad day on the Qs on huge volume has put them in the red for 2014.  Is this is an omen for more downside to come or will we see the usual dip buying and then a pop to new highs? 
That's the $64 question.
One of the very interesting factors in Friday's swoon was the relative strength of the NYAD (NYSE advance/decline line.  We typically see downtrend bottoming when the NYAD drops to the low teens or below (intraday readings below .10 occur approximately 1% of trading days and are usually driven by really bad earnings or geopolitical news). 
The Above chart shows 130 minute bars, so every 3 bars reflects a trading day (6.5 hours =390 minutes/3= 130 minutes).  And we can see that the closing NYAD level was .54...a moderately bearish reading....but not a panic or capitulation level.  NYAD reflects NYSE stocks.
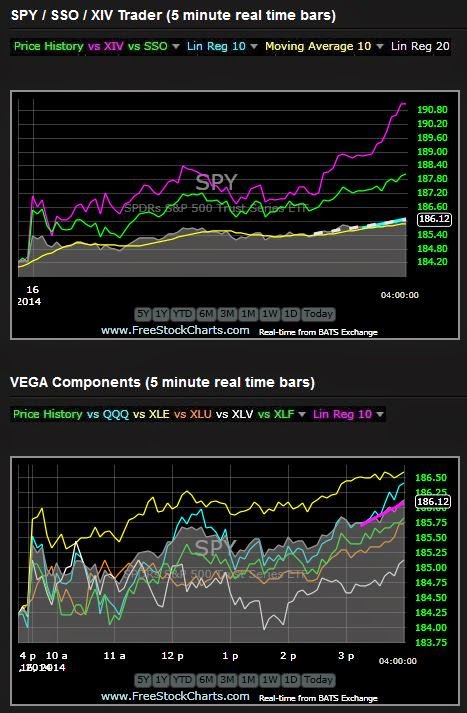
Clearly the Qs were displaying a different fear pattern on Friday as can be seen form the chart below.
The white and blue lines on both charts are the 7 and 20 day moving averages.

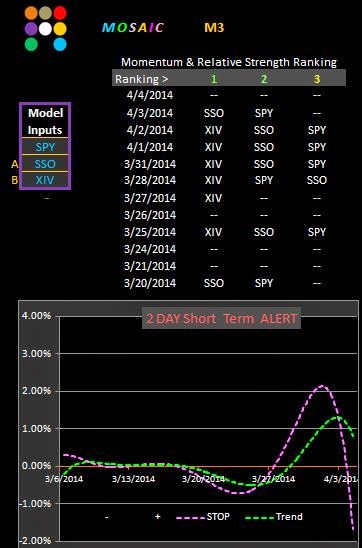
Here's the current status of the M3 SPY.  Our short term ALERT did a good job of letting us know that caution was warranted 2 days ago asw XIV began its fade and SPY began to wane.
Our next opportunity to become vested will likely occur when the pair signals cross the zero line and we'll assess the odds when that happens.

The Qs look a bit risk prone based on a similar M3 run>
In the case of the Qs the short term ALERT fired on the same day but the rankings actually warned us out of the trade a day earlier than in the case of the SPY by failing to even register in the rankings scale....always a side of weakness or impending reversal.
For now the pair charts look very similar to the SPY version with the exception that there is now a zero line cross of the QQQ/QLD pair (A).  This situation may suggest a long QQQ trade for Monday but the QQQ/XIV signal has not confirmed so the element of risk is high.