Thursday, December 31, 2015

The Year Ahead....12.31.15

Last day of the year.  Hope 2015 was a good for you.  2016 should prove interesting with global uncertainty on the rise but let's gird our loins, hunker down and make a few bucks along the way.
So how do we deal with the 2016 risk environment?
I'm an old timer at this game...30 years and counting so I favor playing the odds and not sticking my neck out too far on long shots. That means sticking to what works...delta neutral pairs (or three's) and trading the momentum/mean reversion paradigm shifts in the major indices where the rampant market maker and HFT price manipulation tends to be constrained.
Going forward we'll look at some possibilities that we can turn into probabilities using the paradigm models and/or a delta neutral tactic when the signals are unaligned.
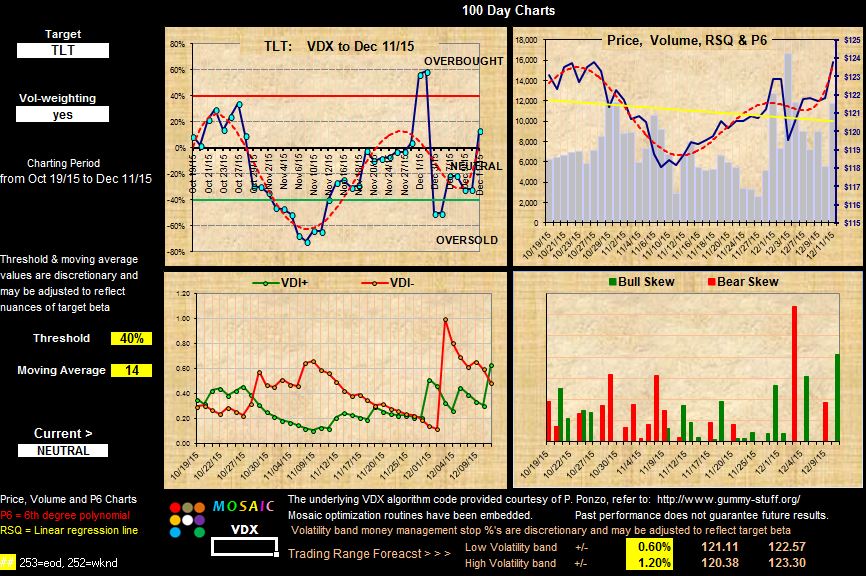
Today's focus...bonds in the form of I-Shares 20 year treasuries ..TLT and its 2x short inverse TBT.
We'll also include our typical neutral outlier XLU (SPYDR Sector Utilities).
Since TBT is a double inverse we have to double the stop setting to achieve risk parity.
Here's the 2 year snapshot of this setup and below that the stop calculation panels.  Note that the stop panels are all downslope RSQ and P6 reflecting a lower VIX and tighter trading ranges. This dramatically affects our current stop settings.....and our risk exposure. 45 days ago calculated settings were TLT .7 and TBT 1.4 and the odds are we'll see those parameters again (maybe soon).
Click on charts to enlarge.


Wednesday, December 30, 2015

A Ponzo Lookback...How did it do?....12.30.15

Here;s the SPY Mosaic Ponzo file from November 23rd. I thought it would be interesting to see if the Ponzo really did deliver actionable forecasts.  Turns out the average risk forecast was one dollar off today's closing price on the SPY.  So maybe there is some value here.  I tend to use the forecast for 4 to 8 week outlooks even though the model is configured to look forward 18 weeks.
We'll check back in another month to see if the same level of accuracy holds.
Ponzo's looking for a little bounce at the start of the new year...following the historical odds projected by the 2016 StockTradersAlmanac.
Meanwhile here's a couple links looking at 2016 risk factors.  Just something to consider......
From Financial Advisor
From Mauldin

Tuesday, December 29, 2015

Mosaic Ponzo Updates for SPY and the VIX....12.29.15

This week's Ponzo updates are fairly benign although the crash scenario stills looms as a possibility and the risk range is expanding.
This week is historically weak and then a surge is possible in the first days of the new year according to Stock Traders Almanac..
Expectations for the new year are generally low and the effects (if any) of the FED rate rise remain to be seen. Election years are historically bullish but if things continue to turn down macro-economically the odds are skewed to the downside.


Monday, December 28, 2015

Final M3 platform out Wednesday. 12.28.15

Several months ago I indicated that the M3 advisory service would be curtailed so that I could focus attention on the LQB hedge fund and that I would make M3 software available to users so that they could continue to conduct market research on their own (with an active support line).  My goal was to cut the cord at the first of the year after several improvements had been integrated into the platform.  It's been a larger effort than I anticipated when I started these platform updates but Wednesday I'll be sending out the final cut that includes a number of major improvements including the ability to use any of the inputs as a benchmark, thereby letting the automatic limit stop calculator recommend the "best odds" stop for any position.  Two year  performance charts for the M portfolio and the benchmark have also been added with the usual P6 and RSQ indicators to facilitate identification of the current paradigm, either momentum or mean reversion. Finally, I've added a separate version of MNR dedicated to momentum followers that allows for analysis or either long term or short term momentum.  I was hoping to cram all these algorithms into a single model but that was not to be.
The MNR model is essentially the old M3 momentum/mean reversion model.  The new MN model is just a refinement of the momentum theme....it's just has more risk control built in. Users that have purchased at least 2 of the software offerings will receive the new models at no charge.
Other M3 users will be contacted individually with an update offer.
The new display array is quite large and does not play well on this compressed site.
Here's a link to what the MNR display now looks like.
The MN array is identical except for the commands.

Saturday, December 26, 2015

VDX Updates...12.26.15

This seek's updates for SPY, XLU nd the VIX produced neutral to overbought outlooks for equities and neutral for volatility....the relationship we would expect to see. That XMAS rally was on subdued volume....which we are likely to see on Monday as well.  Then there's the end of month, New Year's holiday signal mess and quickly following that the first 5 days of the new year which have a uncanny ability to predict the upcoming's year's behavior.  As always. we'll just take things a day at a time following the current paradigm and/or delta neutral tactics.. .

Wednesday, December 23, 2015

Some Resources for M11 Users....12.23.15

Many M11 users ask about portfolio ideas.  Here are a couple ideas and links.
First the entire ETF universe compliments of my hedge fund buddies at State Street..
This is intended for professional clients but if you link up you may find a variety of useful tools.
Then there's always  Finance.Yahoo. com.  If you type in the symbol for a sector ETF like XLE or XLU. etc... in the left margin you will see a variety of info topics including "Holdings".  If you tap that link you will see the top 10 stock positions in that ETF.  Loading those top 10 inputs into M11 with the sector ETF (XLE, XLU, etc.) as the benchmark can often provide an easy way to outperform the aggregate ETF. Keep in mind that you have to be aware of the stocks' beta values to set realistic stops and once again the Yahoo finance page lists the current beta along with the current quote info.
The XLU version of this strategy with a top 2 sort is shown below....click on screen to enlarge.

Tuesday, December 22, 2015

Ponzo Updates for SPY and the VIX....12.22.15

This week's MoPo forecast updates continue to include a scary event horizon crash option that we saw last week.
That doesn't mean it will or won't happen...it's just that the current odds are skewed against it.
That being said....with the current high degree of ISIS uneasiness...86% of the public believe there will be an attack on US soil within the next 3 weeks....if such an event does occur on the scale of 911....the risk consequences will be dramatic.  I was nonchalantly watching the markets on 911 with a TV on my desk when live coverage cut to the second plane hitting the twin towers and the subsequent pandemonium. We don't want anything like that to ever happen again....but we should be aware that recent international attacks make that scenario a real possibility. Just something to consider.

Monday, December 21, 2015

Barron's 2016 Small Cap Picks via M11....12.21.15

I'm always looking for an honest man and a good stock. Here's Barron's top 10 small cap stock picks for 2016 and I've run them through M11 (momentum mode) to see how they would have performed last year.....turns out a lot better than SPY using a top 2 sort.  Once again...past performance is no guarantee of future returns but its easy to see that a balanced buy and hold portfolio of those stocks last year would have produced dismal if not downright frightening results.
Let's put this list on our M11 radar screen and we'll periodically check back for quarterly updates.
PS...I'm not a shill for Barrons and pay for my subscription.  I do get a lot of requests from users on possible M11 portfolios and this is just an idea for your consideration.

Sunday, December 20, 2015

VDX Updates for SPY, XLU and the VIX....12.20.15

After a week of selling carnage the markets looked poised for the typical "Santa Claus Rally" that ensues in a few days before and after Christmas.  If the markets don't pick up soon and the rally fails to materialize then all bets are off and cash is going to be a real consideration because if a slid takes hold even the mean reversion model will be unable to make any headway. 
Current technicals are neutral to bearish but the low volume around the holidays means the big prop shops and the HFT can manipulate the markets with more ease than usual so suspect bullish runs.. 


Thursday, December 17, 2015

Barrons' 2015 Picks on a Weekly Basis. 12.17.15

Last week we looked at how the M11 model improved Barron's top 10 stocks' performance.
Here's the same portfolio looking back 7 years and traded on weekly bars instead of the M11's usual daily bars.  Right away we notice that the daily bars do provide a superior return when looking at the net 1 year returns for the 2 models. (both the daily and weekly models are set to mean reversion mode)  The weekly model also uses a top 2 sort in lieu of the daily version's top 4 sort.  Then we have to consider the commission costs for daily versus weekly models and the amount of time required to maintain a daily versus weekly rotation..
Nevertheless, there's a couple lessons to be learned here including finding a suitably attractive portfolio to apply the M11 filter and then rotating paradigms accordingly as the market dynamics favor either a momentum or mean reversion based tactical approach.


Wednesday, December 16, 2015

M2 Trader Progresses....12.16.15

It's 60 minutes past F Day and the FED has finally raised rates for the first time in 7 years.
The initial reaction was bullish but we'll check back on Friday's close to see if the enthusiasm held. These are the 2 most bullish weeks of the year historically so there's that inertia going forward.
I've made some major changes and refinements to the M2 project over the past few days, in the process re-learning EXCEL programming that I had long forgotten.
The major effort has been focused on automatically calculating the limit stops, which is really the most important part of the program as it calculates and applies current volatility (risk) thresholds to each position. There's a lot of volatility analysis now embedded in the model and the stops are calculated based on 2 separate set of metrics.  Just to make matters more confusing a programmable longer term risk tolerance adjustment factor is included so various "what if " risk scenarios can be
quickly examined.  The M2 dashboard also now indicates whether the current mode is momentum (MN) or mean reversion (MR). Needless to say, the M2 project has been a long time coming and involved much more time and effort than I imagined when I started. M2 is just about ready for prime time although I still need to run some quality assurance tests before releasing.
Thanks to all who offered input ideas and suggestions on making the program what it is.
This is the SSO/SDS version (momentum mode) Top 1...NOT delta neutral which is Top 2..
Probably have to click once on dashboard to enlarge abd see details.

Tuesday, December 15, 2015

Ponzo Updates for SPY and the VIX Index....12.15.15

It's almost as if the Ponzo charts are giving us a contrarian view of the markets based on last week's bullish outlook.  And then this week we're looking considerably more subdued in the forecast.
Keep in mind these forecasts are based on 25 year lookbacks and a lot's happened in the markets over that time.  Those who watch the markets in real time on a daily basis know how the HFTs totally controlled the ebb and flow of price.  This is particularly evident on high volume days like Monday where we saw quarter percent reversals on 2 minute bars, which were then reversed within the next 3 bars.  Yes. the VIX is in the 20s but that kind of action in the big ETFs like SPY. QQQ and IWM is all HFT driven and the trick is to avoid the collateral damage of the whipsaws.  
It's interesting that the standard deviation of the VIX is about 4 based on a price of 20, whereas the SD of SPY is 6 based on a price of 205. Let's hope we don't realize that VIX yellow line forecast (or the SPY yellow line).

Monday, December 14, 2015

A Weekly Version of M11...12.14.15

This is a version of M11 using weekly bars so you only have to rotate positions once a week.
As with the old T2 model if a position is stopped out you just wait until the following Tuesday AM to open new positions. We have to set the stops a bit higher than the daily model since we are covering risk for a week (on a cumulative basis).  The M11 portfolio is the default daily model and the limit stops are arbitrarily set at 2% for all inputs.  This is the mean reversion mode.
Note the highlighted 7 year returns and the differential risk exposure of SPY against M11.
This is a top 4 sort which works fairly well in conjunction with the full beta spectrum inputs.
Click once on dashboard to enlarge.>>>>>

Saturday, December 12, 2015

VDX Updates for SPY, XLU VIX and TLT....12.12.15

Looking forward to the historically bullish next week we're coming off the worst week since August and certainty not tracking the latest Ponzo forecast, which suddenly turned bullish ;last Monday. Currently SPY is below the 200 and 50 day MAs and extremely oversold by any technical standards.
The VIX is now wildly overbought after a 30% rise on Friday. In the past one day surges in the VIX that exceeded 20% were destined to produce a positive day for SPY 90% of the time.
We'll just have to wait to find out if Monday's close yields the expected results.
We are suspending coverage of FXI (China 25).  The highly manipulated Chinese markets and the questionable validity of state issued economic and policy data make China unattractive for now.
Next week, in case you've been in an isolation booth, the FED is expected (86% Fed Fund futures consensus) to raise rates by .25% and opinions are varied on whether this long awaiting change in FED policy will create more or less volatility in the markets.
Work continues on the XX volatility model including the limit stop indexing routine.
See Fridays; M3 Insight.


Thursday, December 10, 2015

M1 Volatility Model Progress....12.10.15

We're chugging along with improvements to the volatility model including 3 algorithms (ATR, SKEW and Median) that track both 30 day volatility using a spectrum of metrics.  I generally favor a visual data display and have used pattern recognition for years to gauge market odds.
Looking at the 3 lower new volatility based charts within the M1 dashboard we can quickly see that both the ATR and the PCL (previous close to today's low) are increasing.
The third chart on the lower right has a more benign pattern, displaying a mere .76% delta for the median day open to close range. The obvious conclusion is that the big action occurs overnight and this helps us to craft the limit stops accordingly since we now know the likely intraday range swing.  
M1 is still a work in progress but these latest metric additions will facilitate gauging the stop odds.

Wednesday, December 9, 2015

Mosaic filters Barron's top 10 Picks...12.09.15

Many savvy investor &.traders read Barron's magazine each week.  They're running a promotion right now that's pretty attractive. Some articles are free, some are locked if not a subscriber.
This week they selected their top 10 stock picks for 2016....and also looked back to how their top 10 picks for 2015 have performed., which turns out not so well, with a net loss of 6% for the year in an equal weighted portfolio of the 10 stocks.
Here then is how that same portfolio would have fared using M11, a top 2 sort and our default stops.
Yes, there would have been some slippage along the way because some of these stocks had really bad days that would have blown through our stops and commissions are not included.
Nevertheless, M11 is designed as a starting point, not a final solution and even after handicapping our model by 20% for the vagaries of the market an 80% gain looks a lot better than -6%.
I've also loaded up Barron;s picks for 2016 on the M11 platform and set a top 2 sort.
We'll check back each quarter so see how M11 is performing relative to Barron's passive strategy. Past performance is no guarantee of future results but this looks a case where a $ 50,000 portfolio of Barron's top rated stocks would have produced somewhere in the neighborhood of a $40,000 return using M11 as opposed to a loss of 6%,
Hint for accumulation:  buy on a 3 day low for the SPY or when at lower oversold levels per VDX.
This is why I believe in technical analysis and active money management.
And looking forward >> Here's how Barron's picks for 2016 would have performed in the past.

Tuesday, December 8, 2015

MoPo forecasts updated for this week's VXX and VIX (not the XIV)....12.08.15

As mentioned yesterday here are the new MoPo forecasts for the VIX index and VXX.
Note the attached VDX chart for the VIX also.  The volume toggle has been turned off on the VIX as there is no volume, only open interest, which cannot be tracked by by the VDX.
Time is limited today as I'm on the road and  M3 Insight will be early but tomorrow we'll consider the variations between last week's and this week's volatility MoPo forecasts.
Thursday we'll look at how Barron's 2015 top 10 stocks fared for the year and how M11 could have provided a much more attractive result using a top 2 filter..


Monday, December 7, 2015

Volatility Ponzo studies for VIX index and VXX...12.07.15

Followers of  Mosaic Ponzo (MoPo) forecast charts know they update weekly at Monday's close.
As part of my recent push to refine the  M2  XIV/VXX trading model I have been looking at technical tools that might be useful.
The following are last Monday's updates for the VIX index and the  VIX ETN proxy VXX.
Tomorrow we'll post tonight's update for comparison to check alignment and trend. We'll also be integrating the VDX signals into the M2 platform as a confirming signal.
The focus on this week's posts will be volatility while I work in the background on some M3 site housekeeping and infrastructure upgrades.
Keep in mind that VIX is the volatility index based on S&P put contracts and can only be traded as options or futures.
VXX is an ETN (exchange traded note) that looks like an ETF but is based on VIX futures.  It trades like a stock on huge daily volume (50 million) and has a wide robust option chain that trades narrow spreads with high liquidity. It also trades after hours. Since VXX is based on VIX futures contracts it has an intrinsic decay function that must be respected.  VXX should never be considered as a long term buy and hold product unless the position is short.IMHO.


Sunday, December 6, 2015

VDX Updates for SPY, XLU and TLT.....12.06.15

This week's VDX updates reflect Thursday's selloff and Friday's subsequent bounce.
Please be aware that the current market milieu is HIGHLY MANIPULATED and may not necessarily react to technical analysis is the "normal" manner.  If time and space permitted I could post many, many charts of Thursday's action to show how .05% volume moves resulted in 1% price moves and that's not the way we expect price to move.  Nevertheless, caution is the current watchword although the bulls have an historical edge for the next 3 weeks.  The Thursday crash of TLT was overdue but skewed out of proportion to similar fixed income volatility.
Best advice?  Trade small.


Friday, December 4, 2015

M2 Volatility Trader Debuts....12.04.15

Regular readers know I've explored many ways to trade volatility both in conjunction with and separate from equities since there are frequent periods of divergence in the synchronization of price and volatility.  Based on reader feedback I know this is an area of considerable interest.
This new M2 model reflects parallel improvements in the M3 models and has as default inputs XIV and VXX, the VIX  index derived ETNs...highly liquid (almost 100 million shares between them today), penny spreads and, in the case of VXX, a rich option chain with narrow spreads and robust open interest. And here's the best part....XIV and VXX trade after hours with good volume.
Below are screen shots of 3 optional settings for M2  > > > > >
First the momentum based top 1 model.  MN
Then the mean reversion top 1 model.     MR
Then the delta neutral version holding both positions and letting the stops do the work.    DN.
Keep in mind that M2 is trading inputs with beta that may approach or exceed a value of 6 so you have to stay focused and keep your wits about you if reversal days kick in.
Other inputs can be substituted for XIV and VXX but the algorithms are tuned for volatility delta..
M2 will be added to the Mosaic software catalog over the weekend.
Mean Reversion below:
Delta Neutral below:

Thursday, December 3, 2015

A Technical Breakdown...12.03.15

Volume was almost double yesterday's and the bulk was to the sell side driven by disappointment with ECB QE inaction and the growing conviction that Dec will see a rate hike.  There was no hiding place for safety...the dollar was down 2% as were bonds and the safe haven of utilities caved in also.
There were some significant technical threshold breakdowns and the limit stops in bonds failed to perform.  The delta neutral models have proven their worth over the past 3 days and as market volatility surges (the VIX was up over 20% today) the risk buffer provided by such a strategy becomes more and more appealing. See today's update.
These are the hourly charts of the UUP (dollar) and TLT (30 year Treasuries).


Wednesday, December 2, 2015

M11 Prospector Update....12.02.15

The M11 project has taken on new possibilities thanks to beta users input.  Here's the latest version that allows a limit stop to be set for each of the 1-11 inputs. This example is similar to the classic 60/40 stock/bond portfolio allocation widely used in the past by money managers.  This of course is just one mix of equities and bonds but it illustrates the utility of this platform. Coming this weekend.

Tuesday, December 1, 2015

SPY Ponzo Update Looking BULLISH...12.01.15

This is a bit of a surprise but the latest SPY update is looking bullish for the first time in many weeks..  Of course things could get derailed in a heartbeat on bad news but the French terrorist strikes, the downing of the Russian jet, the ongoing advances of ISIS  and the less than stellar earnings reports have done little to put a hamper on the current mood of muted enthusiasm....so, maybe the Ponzo's onto something.
Today's the first day of the new month and we're seeing green for now but many early green positions have turned negative and the NYAD is not behaving in an enthusiastic manner so caution is advised.