Thursday, July 30, 2015

A Few Bumps in the Road...07.30.15

After yesterday's ALL CLEAR signal issued by the FED we might have expected a bit more strength than we saw today but there's still a lot of money on the sidelines and technical traders may be biding their time to play the high bullish odds of tomorrow's close through Monday. Meanwhile, the overriding VDX technicals show there's still some upside left on SPY and XIV although we should point out that when XIV pulls back its generally in a dramatic fashion.   Once that VDI+ turns down we don't want to be Long XIV.  Our market neutral model using SPY, XLU and SH has been doing nicely with only a 1% total drawdown over the past 2 years, the lowest DD of any of our 6 models.

Wednesday, July 29, 2015

Continuation Day...07.29.15

Today looked an awful lot like yesterday and we may be seeing some further bullish action into next Monday if no ugly surprises develop.  These final days of the month have an historical bullish edge, although the biggest gains are typically the actual last and first days of the month.
We can see from the SPY chart below for the past 2 days that the Ergodics have been in sync with the ADX, further indicating that the buying has been true accumulation not just HFT.  The two day pivot chart shows SPY hitting R1, although in reality the SPY hit R2 based on today's range only.
We have a new and hopefully final refinement on the M3 dashboard, having replaced M4 with the Composite model reviwed in yesterday's post.  With this addition the daily update includes 2 momentum, 2 mean reversion, 1 market neutral and 1 composite model...providing a multi-faceted view of current market odds.
  

Tuesday, July 28, 2015

A First Look at the new Composite Model...07.28.15

Here are 2 versions of the new M3 composite model that integrates multiple risk parameters and momentum/mean regression algorithms into a single trading entity.  Both versions use 5 inputs but one uses the leveraged ETFs  SSO and SDS + SPY,SH, XLU and the other uses XIV and VXX + SPY, SH and XLU. Depending on your risk tolerance and trading goals one of these two should provide a solid foundation for a daily trading format. Note the different auto limit stops for the 2 models....we have to allow a lot more "breathing room" for the XIV/VXX model since the beta is normally 2 to 3 times greater than the leveraged SSO and SDS.
There are a few nuances of these models that I'll discuss in coming posts before one or both are added to our daily dashboard.  Click once on the chart to enlarge.
New M3 password activated at 9:00 PM PST tonight (Tuesday). 


Monday, July 27, 2015

Slide Continues....07.27.15

A whopping overnight 8.5% drop in the Shanghai market spilled over into today's action. The encouraging factor was SPY didn't fall further, but instead waffled between the S1 and S2 pivots....ultimately closing close to S1...but on divergent Ergodics and ADX signals...so a bit suspicious.  With all this volatility (VIX up >17% midday, closed up  >13%) we would expect our aggressive, high risk models to be surging.  In fact, it's the low risk Lazy Man and simple market neutral models than are the best performers.  We're still cautious of a SPY revisit to 204 levels before a high odds rebound into Thursday and Friday.
Subscribers please remember the M3 login password will be reset Tuesday night at  9 PM PST.
Passwords were emailed on Sunday to all registered users.  If you haven't received please advise me.


Saturday, July 25, 2015

Weakness and VDX Update with a low odds BUY...07.24.15

Friday was extraordinary for the stunning weakness in the 130 minute RSI2, which opened at 2 and finished at .25   I actually don't recall ever seeing a value that low and the implication is simple...no buyer interest.  OK, there was a little mercy buying in the last 10 minutes but this could simply be the prop shops pumping the longs into the close so they can sell them down hard on Monday...a little trick I learned from my days as a prop shop trader years ago.
For M3 subscribers ...you can see the current module profiles here...they will be posted each weekend so as to help see the dynamics occurring in each model throughout the week..
The current signals are mixed..both long and short... and that's because the mean reversion models of SPY and XIV have fired.  I've talked before about the danger of a Martingale strategy...you do not want to keep buying on the way down....and its unclear right now if we're going to see any recovery next week  as we are still likely to revisit the recent SPY low of 204...which is about 4 points further down the price line from current levels. (see previous VDX buy thresholds below).
As a result of these technical factors I consider the SPY and XIV MR long signals high risk.   A more likely scenario is an end of month/first of month rally at the end of next week.
We'll be changing the M3 password next week and subscribers will be emailed the new log-in tomorrow.


Thursday, July 23, 2015

GSPC Ponzo...07.23.15

This is the GSPC or S&P500 Ponzo chart for which we have data going back 50 years.  Compare these forecasts with the previous SPY ETF forecasts for which we have 25 years of data.  The GSPC is presenting a much more optimistic risk profile for the rest of the year and it will be interesting to see which format, GSPC or SPY, delivers a truer picture of the future...which unfortunately we will not have the ability to know until 5 months away.  The disparity in these two risk profiles is not intended to confuse the reader but simply to provide an alternate view of what's possible. Keep in mind that bear markets (with the exception of the late 2008 plunge) tend to occur when there's nothing but good news and optimism.  On the other hand, we may have already passed that point and be in the initial phase of a larger retreat.  For now we'll just take it one day at a time and apply our models as appropriate.  M3 did give a nice exit signal to the short side for today's action and SPY has collapsed to below the S3 pivot 30 minutes before the close.


Wednesday, July 22, 2015

Ponzo Update...07.22.15

Here's this week's update to the SPY Ponzo risk forecast and the risk profile has expanded beyond last week's wild skew.  The forecast is now firmly negative longer term and is looking for a significant plunge within the next month.  Keep in mind these forecasts are based on a 25 year lookback at how SPY has performed when analyzing the past 25 weeks of price action so if you believe history repeats itself then this model is for you.
I was in the doctor's office yesterday paging through the financial section of  USA Today and noticed that of their 6 model portfolios Apple was the most bought and the most sold stock in all of them. So far today (midday) APPL has traded 90 million shares and SPY has traded 55 million and APPL has recovered about half of its overnight 10 point plunge.  The markets are still under overbought pressure but today's action may ease a lot of that.
Don't forget that tonight is the premier of Sharknado 3 on the Sy-Fy channel, promising to be one of the true cinematic entertainment events of the year.


Tuesday, July 21, 2015

Apple Falls From the Tree....07.21.15

Expectational analysis suggested Apple might not be another Google and this morning's mini-selloff in Apple was an omen that insiders likely knew what was coming and were taking positions off the table.  If you think I'm paranoid then you better read up on Steve Cohen and a few other high profile hedge fund managers who made gazillions by finding insiders to leak earnings reports and then trading according.
The M3 models are now all in cash and one worrisome item I've noticed recently is the increasing number of analyst downgrades to the "Blue chip" sector components. This sell side skew has been building for a few weeks via www.theflyonthewall.com (paid site) and we may be starting a leg down here.  Apple is down about $10 after hours but may recover by the AM.  The earnings report wasn't bad it just wasn't the blow out numbers that optimists had been hoping for.
The VDX SPY update now shows SPY at longer term overhead resistance with flat momentum and waning volume.

Monday, July 20, 2015

Waiting on Apple....07.20.15

Apple reports after the close tomorrow and positive momentum is building ahead of that event....and was almost solely responsible for today's pop in QQQ (of which Apple comprises 20+%).  On the bigger picture things weren't quite so positive and the odds of a pullback increase each successive day a one fails to materialize.  Here's a look at today's action and the close was not bullish.
Below that is a new composite graphics panel that was added to the Mosaic site today and which combines various TrendX graphic modules into a single panel in order to better understand the current technical picture on SPY. This panel will be undated end of day each day with the six unique M3 models only posted once a week unless something surprising develops (which is often).
Note that the 2 day ALERT stop has crossed over price....this is ominous. (click once to enlarge)


Friday, July 17, 2015

QQQ Surges...Can It Hold?.....07.17.15

The Qs were on fire today gaining almost 2 % while the rest of the indices lagged.
Going into Monday we are net long although we continue to be VERY, VERY overbought.
We have a new format and layout on the M3 site that produces a true mosaic signal of momentum, mean reversion and market neutral signals.  Thanks for the positive feedback so far.
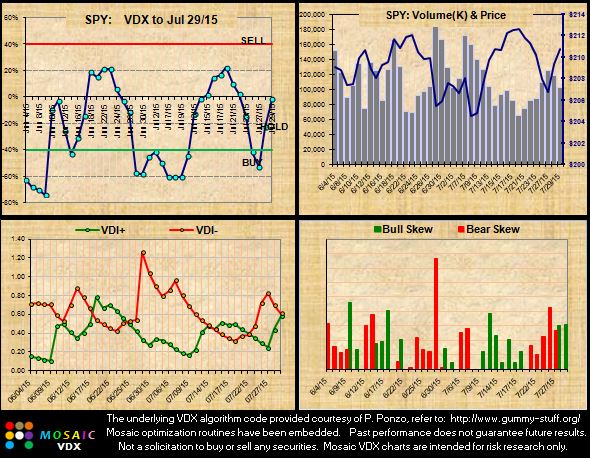
Here's a look at today's M4 update and the things that bother me about the technical panels are 3 fold.
One> the continued divergence of XIV and SPY...historically this skew cannot be sustained and we are currently way outside the standard deviation bands, so that's a caution flag.
Two> the ALERT signal looks about to turn down...meaning a waning of momentum and a likely change in trend, that's another caution flag.
Three> XIV premium is fast approaching long term overhead resistance and when XIV reverses it tends to do so in a dramatic fashion, and that's another flag.
Maybe we're going to get a huge bump here and the markets are going to surge higher but the technicals suggest a frothy environment filled with multiple danger signals.  
Apple reports on the 21st after the close and that may be the go or no threshold.
So far most earnings reports have been above expectations and VIX has been steadily falling..


Thursday, July 16, 2015

Stepping Up...07.16.15

A strong day with an SPY open jumping to R2 and sticking at that level all day.  The closing was equally strong and going into OP EX Friday (typically weak...especially into the close) we are confronted with multiple Long signals in the M3 model portfolio.  We're getting very overbought on the indices and QQQ and XLF hit new highs today so the odds are SPY's not far behind....even though the odds for a pullback increase with each successive day up.  This, of course, is all technically speaking as the wall of worry seems to have been at least temporarily forgotten.
We are very cautiously Long going into Friday's open and are likely to impose trailing stops within the first 20 minutes to preserve our recent gains.


Wednesday, July 15, 2015

SPY Ponzo and VDX Updates...07.15.15

Here's the latest SPY Ponzo Update and I really don't like the "best fit" chart inside the bigger Ponzo risk forecast.  The skew between the high and low range has been increasing over the past months and the odds of a break one way or the other have increased accordingly.
Other than blow out earnings its hard to figure what the catalyst might be for an upside breakout while there's lots of risk factors that might set that best case fit in motion.
There's a new magazine, Modern Trader with some great content provided by a number of real deal hedge fund managers and economist types.  It's not free and the articles aren't downloadable so I can't share but the feature article this month is 10 reasons to sell equities and there's a number of compelling reasons to consider such a plan.
Today we introduce a brand new model performance dashboard on the M3 site along with a new market neutral model.  Hopefully this new dashboard will provide a useful thumbnail of potential risk/rewards scenarios, especially if the markets do start to crumble..
.

Tuesday, July 14, 2015

A Simple Market Neutral Model...07.14.15

Pairs trading is the classic example of a market neutral strategy but here's another approach that is very risk adverse and still keeps making money is an up or down market. We use the M3 platform and view the performance of 3 inputs > SPY, SH and XLU.  I've talked about the logic of using XLU as an outlier in this type of long/short model before and this is just a variation of that idea. We use the same .6% limit stop across the board and if you look carefully you'll see the "2" box in the header checked...meaning we have vested positions in the top 2 ranked issues at the close of each trading session. What's interesting about this tactic is that it makes money whether or not we turn on the 3 day mean reversion auto stop. (green "MR" box in header).  Without the auto stop the model just kicks out a ranking based on positive 10 day momentum and relative strength.
Going forward with the Mosaic site we'll be posting 4 daily updates soon, including one of these 2 models (yet to be determined) the SPY and XIV LABS and either M3+ or M4. That model portfolio should provide a full spectrum of defined risk profiles to suit your particular comfort level.....and when we get consensus across all the models we can be more assured of a favorable outcome...discounting the always unknowable news surprises.
First, with no mean regression auto stop>
Then with the mean regression auto-stop>

Monday, July 13, 2015

A New M3 Paradigm....07.13.15

The markets have been frustrating for technical traders for the past few months and M3's equity curves  have suffered as a result.  Although the curves have stayed above the RSQ line support line the lack of any sustained momentum and trend follow-through has produced many cash days and many whipsaws. So how do we deal with these stagnant market conditions and get back to making some risk buffered money?
As part of my recent hedge fund strategy formulations I've made some adjustments and additions to the Mosaic toolbox of market tactics.
Here they are in a nutshell and going forward all four signals will be posted daily on the subscriber site.  The M3 site will be revised later this week to reflect the underlying logic and risk management philosophy of these new models and for the short term I'll also continue to post the daily LM and M3 signals as a sounding board for the new regime of models.
The first 2 models focus on a single ETF/ETN.....either SPY or XIV and the signal is either on or off with a specified limit stop....which we've examined previously as far superior to a simple stop loss. These are mean reversion algorithms looking to buy on weakness and sell on strength.
The later 2 models, a refined M3+ and a new M4 retain the sliding beta approach and are momentum based models looking to buy strength and sell higher.  M3+ contains SHY, our cash proxy and uses a slightly slowly momentum algorithm than M4.  M4 has no SHY component so the vested bias is much more defined.  Once again we utilize defined limit stops to mitigate drawdowns.  These are just thumbnail descriptions  of the models...there be more details in the revised site this week and next.  


Saturday, July 11, 2015

VDX Updates + links....07.11.15

Here's the Mosaic VDX outlooks for SPY, XIV and VXX.  Clearly the volatility ETNs are stretched far outside their "normal" expansion zones and if we just look at the technicals on face value it would appear that the bulls have odds in their favor.  Things aren't quite so simple however once we consider the various global macro economic assaults on the markets and ...just to boost the uncertainty a bit further...earnings season kicks off next week and then Friday's is options expiration.
That's a lot of volatility factors all occurring simultaneously so, needless to say, caution is warranted.
Here's two links that provide educated observations on the trading environment and the China factor.
Randy Frederick is head of Schwab options trading who actually trades.  I've known Randy for years, he's the real deal and his feel for the market pulse has a proven track record.
Then there Evergreen Capital, a hedge fund that offers a weekly state of the markets update and this one is focused on China...again authored by someone actually in the trenches and not just talking off he top of their head.  The piece is long but if you're concerned about your capital account it might be worth your time.


Thursday, July 9, 2015

Don't Look Good....07.09.15

Despite the NYAD opening at an amazing 10.32 it was all downhill for the rest of the day and according to the ergodic/ADX convergence it was real selling, not HFT arbitrage. That nasty little plunge at the the last 5 minutes doesn't bode well for Friday, which has bearish odds of 75% .
The VIX weekly chart going back to 2013 below shows that there might be a washout day about to occur.  Past surges in the VIX have culminated at the R3 level....we're not there yet and Friday or Monday could be ugly.  By the way we have a new final, last chance, we're not going to put up with this any more line in the sand for Greece...this Sunday....after which we'll probably have another line in the sand if things don't get worked out. Many "experts" claim a Greek departure from the Euro is already pretty much factored into the markets as a result of the slam/bam declines we've seen in the past 2 weeks.
Overnight the Chinese markets rallied and ended the day up 5%...basically flatline for the entire US session. Now this looks great on the face of it but you have to realize that overnight the Chinese banned short selling and threatened to arrest anyone who tried it and barred anyone with >5% position in a Chinese company from selling for the next 4 months.  There were a few more rules designed to slow the fall including market breakers at various levels but the net affect was to hamper both speculative and vested sellers from the entering the arena.  


Wednesday, July 8, 2015

Back to 204 Support and the Ponzo Update....07.08.15

A truly ugly day with the VIX rising 22% and SPY plunging close to the 204 line in the sand. Yesterday's action turned into a Trap Door from today's open and there was no rebound to allow a gracious (net zero loss) exit.  Both VXX and XIV were +/- 10% and the surprising thing was that despite the pervasive selling SPY did not penetrate the S2 pivot.
China was down another 7% and there may still be room to fall on that issue (FXI) before we see some stabilization.  That, coupled with the situation on Greece (next deadline in this Sunday) kept the markets in upheaval.  We saw some big names crater today (like Apple), illustrative of breakdown patterns that had not been evident before.  Technically we are are the edge of a fall into the abyss (SPY 199) but are also extremely oversold once again.
Below is the latest SPY Ponzo update with the risk forecast for the next 18 weeks.  One thing that is immediately apparent is the disparity of the forecast lines as well as the expanding range of those forecasts as compared with the previous few weeks. Not a good sign.


Tuesday, July 7, 2015

SPY, China and VIX....07.07.15

In the first 2 hours today SPY dropped sub S2 pivot to hit 204....the mid term support level and then began a steady grind up for the rest of the day.  Coming off extreme oversold levels this recovery move was technically expected but the Greek,China, PR situations still have the markets spooked. Volume was about 25% above normal and that pace was evident from the opening.
The metals were particularly hard hit, with gold and silver being down +/-5% for most of the day.
China dropped another 6% early on but recovered to 4.5% down at the close.  The VIX index was equally wild with over a 20% swing intraday.  We are in cash with a bullish bias.  This may hold for the next 2 days but unless Greece gets resolved by Friday we expect Friday to be negative and the following Monday to be another explosive sessions.  For now we'll just play it one day at a time.
The 4 hour bar charts of SPY, China (FXI) and the VIX are shown below.


Monday, July 6, 2015

To Hell and Back..07.06.15

Geez....listening to the late national news on Sunday night you would have expected the DOW to open down at least 250 points today.  As usual the talking heads exaggerated the situation a bit. Nevertheless it was an ugly open and real roller coaster ride for the rest of the day.  Our models are now mostly in cash having been stopped out of the SPY and SSO positions in early going.  Greece has now become something of a bad joke and Tsipras's credibility is near zero so we're likely to be hammered with Greek induced volatility for some time.  When they finally do get it ironed out we can expect one whopper of a rally.....unfortunately there will likely be a number of false starts before we get there.
Farther down the page is the FXI (China) chart, which continues to deteriorate (down another 4% today).  There's actually fairly strong support down at the  42 level and if we get there it may represent at least a modest risk/reward opportunity. Note the nice technical alignment of the ergodics and the ADX on the FXI chart...this is real selling.  The same 4 hour chart on SPY in much more technically convoluted.
 

Saturday, July 4, 2015

SPY VDX and TrendX Update...07.04.15

Hope your July 4th is safe and sane....various situations around the world and at home are anything but.  Here's Mauldin's latest post with some frightening info on China and Puerto Rico.
Monday promises to be explosive in the aftermath of the July 5 Greek referendum vote.
Meanwhile Thursday's closing 10 minutes could almost be considered bullish ( back to the pivot after hanging around S1 much of the day).
The latest SPY VDX update is posted below and also the daily TrendX chart. We certainly don't want to see a breakdown below these levels.  If that happens things could get ugly in a hurry.


Thursday, July 2, 2015

Trap Door Opens....07.02.15

No surprise but the Trap Door setup kicked in at the open.  Hope you avoided that one.  Our AM post suggested a trailing stop on SPY at net zero and that worked out well. If you're not completely exhausted by the Greeks here's Schwab's take...an objective analysis suggesting the "crisis" may be somewhat exaggerated. Nevertheless, traders hate uncertainty and the HFT's love to game it so as noted in yesterday's post Monday may be another blow out day.
Meanwhile, here's the latest MR research and there's been a quantum level discovery in the process.
Below are 2 examples of the XX version with XIV and VXX volatility ETNs as the only inputs.
In the first panel we use a slower momentum algorithm than M3 and we trade only the top ranked issue with a 3.4% limit stop.
In the second panel we use the same algorithm but we maintain an on-going position in both VXX and XIV (equal dollar amounts) at the end of each day and let the 3.4% limit stop cull out the loser as appropriate on a day to day basis.
Note the max drawdowns in each version.  Which one would you trade?  For me the second version is a no brainer.  The risk/reward factor is so attractive that's its hard to make a contrary argument.
The first panel is a true momentum model while second version is essentially a market neutral model trading volatility arbitrage.
Why is there a third ranking slot?  That slot accommodates a neutral outlier as mentioned in a previous post which may or may not be active depending on the current in or out of paradigm regime.
We are currently "in paradigm" based on the position of the equity curve relative to the RSQ line, so no outlier is needed.


Wednesday, July 1, 2015

Trap Door ALERT...07.01.15

We're done with June, historically a down month and calendar watchers were not disappointed.
The bulls, on the other hand,........... OK, now what?  the days before and after July 4th are historically red.....just something to consider and since the markets are closed Friday tomorrow is effectively the last day of the week = 72% red odds. The rally today was marginal and we can see from the daily chart below there's actually pretty good odds that we could revisit SPY March/April support @ 199.  And don't be lulled into the bulls camp thinking the Greek situation is resolved with Tsipras's letter kinda agreeing to European parameters. We've got miles to go before that issue goes away and the Europeans are inclined to wait for the July 5 Greek referendum before moving forward in any way. Bottom line, we are are the ledge of a potential Trap Door, when rosy hopes turn into dismal selling......and, in case you missed the fun last Monday we are now poised to have another explosive opening next Monday based largely on the upcoming weekend events in Greece.