Friday, May 29, 2015

QQQ 50 day Butterfly...05.29.15

While we're watching the market undergo a mini-swoon today we should also note that our Ponzo model has been dead on forecasting this week's action.  And, as a follow up to yesterday's post here's the actual QQQ options butterfly setup the model is indicating.  There's a free site I mentioned before to explore the various options risk/reward scenarios and these are the calcs for our trial trade.  We'll check back in a month to see how it's doing and then at 50 days...the defined options expiration date. Some brokers will let you put on 3 legged options trade for one commission although most will charge you a double commission.
Keep in mind this is just a trial balloon trade but the risk/reward ratio is pretty attractive.


Thursday, May 28, 2015

Roller Coaster Ride Continues...05.28.15

There was no follow through on yesterday's strong close, presumably due to the Greece credit collapse.  The Euro was actually up but the Chinese markets plummeted (6.5% at one point).
Once again we're swimming in a sea of uncertainty with occasional whirlpools of optimism.
Here's the latest on the QQQ Ponzo update.  I'm spending a lot of time developing a couple new models based on QQQ since the QQQ forecast appears much stronger than the SPY....which is a characteristic of a bull market.  It may all end in tears but for now we're looking at a two pronged approach using a market neutral strategy (the options Butterfly band) and the LVQ incremental daily model posted yesterday.  Tomorrow I'll post the weekly version of the LVQ going back 7 years so it includes the 08-09 crash.  I think you'll see the merit of this incredibly simple system.

Wednesday, May 27, 2015

Turnaround Push a new QQQ model and more...05.27.15

The oversold condition of SPY yesterday created with a plunge to S6 was reversed today with increasing momentum throughout the day and closing on the near highs of the NYAD.....bullish.
The intradday Ergodic and ADX chart shows in sync behavior suggesting real accumulation not just HFT chatter.  We're coming up on the end of the month, typically bullish, so we may see continued strength into next week.
We have a new low volatility QQQ based model (LVQ) that will be one of the cornerstones of the Mosaic hedge fund to be launched in the Fall.  The future of the current Mosaic Newsletter and daily M3 updates is under review to determine if they are legally and logistically compatible. Be assured there will be no disruption of the current service without at least 30 days notice.
Tomorrow we'll look at the companion QQQ Ponzo forecast and an outline of a strategy to reap potential benefits with rigidly defined risk.


Tuesday, May 26, 2015

The JAWS Pattern ....05.26.15

Per Saturday's post regarding the narrow band conditions and the expectation for a subsequent biqg move....we got it today and it was an ugly JAWS pattern (see SPY VOXEN chart below).  The Ponzo and Pairs models had argued for a bearish opening today and it went from bad to worse with SPY ending at the S6 pivot and the NYAD never showing any buying strength.  Tuesdays and Wednesdays following Memorial Day tend to be bearish with a potential turnaround on Thursday. The longer term momentum still looks bullish as long as this drop doesn't accelerate into something more than a modest pullback.


Saturday, May 23, 2015

Looking for Mr. Goodbar...05.23.15

Here's a variety of weekend stuff including the daily Ergodic/ADX chart showing the HFT dominance on Friday, the current Ponzo SPY Forecast and VDX mosaic for SPY and XIV and the SPY TrendX.  I hope you had a chance to read the Schwab piece on performance metrics....the whole CAPE concept puts the current P?E status in a different light.
Going forward next week (Monday's not a trading day) the various graphics project a neutral to down odds scenario and I'm a bit concerned about the SPY TrendX rolling over.  We are setting up a narrow band (wedge) consolidation on decreasing volume (see the VDX mosaic chart).  Narrow band patterns tend to behave like coiled snakes and when the bands are broken it tends to be in a dramatic fashion.  That doesn't help us a lot right now other than to watch the stops and be ready for a likely pop in volatility. As I mentioned in Friday's M3 closing comment, the XIV is extremely overbought by most metrics....more so than what is suggested by the attached VDX mosaic.


Thursday, May 21, 2015

A Schwab White Paper as we wait for the Break...05.21.15

Here's today's Ergodics/ADX chart of the SPY and for those that haven't been following along the thesis is that divergence in these indicators reflects HFT activity versus the trend while indicator convergence reflects true accumulation or distribution.  It's been noted that in divergent situations the ADX tends to lead the Ergodics, which is really a proxy for price.
Those using the VIXEN approach will appreciate that this little nugget of info can be very useful as a confirmation signal for both entries and exits.
I regularly listen to the one hour bi-weekly charting presentations offered to Schwab clients (I"m not trying to push Schwab).  Today they talked about an interesting series of white papers available to the public,  This current one offers some original thinking on what performance metrics may or may not be telling you.

Wednesday, May 20, 2015

Keeping Pace...05.20.15

The markets basically went nowhere today, even with The FED minutes offering an excuse for a rally.  There actually was a rally minutes after the FED release but the mood couldn't be sustained and price fizzled down into the close. SPY is still overbought on a daily basis although the consolidation of the past 2 days has worked some of that off.
Surprisingly, there was little evidence of HFT price manipulation per the ergodic/ADX alignment so we're left with a neutral (cash) forecast for Thursday and then the usual negative bias for Friday...which is more likely than not considering Monday is Memorial Day and a non-trading day.
XIV is WAAAY overbought and M3 signaled an end to short term bullish prospects at the close.

Tuesday, May 19, 2015

Too Good to be True...05.19.20

That's my initial thinking after discovering this ultra simple strategy for trading SPY (and other issues).  As I was tinkering with refinements to the limit stop settings I wondered how SPY would fare if the only filter placed on it was a limit stop.  First I tested daily bars looking back 2 year with a .7% daily stop...that is, if the limit stop exercises on any given day you just buy SPY again at the close....no momentum filters, no auto-stop etc.....just hold SPY...no shorting, no cash.  The max drawdown and linearity are stunning.  But I wanted to see what happened during the crash of 08-09....how did the model fare then?...so I ran weekly bars back 7 years.  In this case if SPY fell more than 1.5% during a week then the position was closed but we reentered on the Friday close of that week....and so on and so on.
 Here are the results:  It may be tempting to say "well, I'll just do this, it sure cuts down on the time I have to watch and track the markets, not to mention commissions.etc."
Hopefully, you'll recognize that this is a one trick pony and that, while essentially a no-brainer,  the markets are fickle and a diversified risk model like M3 has distinct advantages.
And here's the weekly bars study going back 7 years:

Monday, May 18, 2015

QQQ Update + The Smartest Guys in the Room....05.18.15

Here's a look at the Ponzo update for QQQ...longer term its actually more bullish than last week although short term is showing a negative bias.  Per my comments on China last week here's a report from the Mauldin's annual showcase symposium featuring some of the smartest guys in the room from an economic standpoint.  They reflect a diverse view of the future on both a global and national level and if it weren't for the web you as a normal mortal would never have access to these reports.
There's a lot of content here but well worth your time IMHO.


Saturday, May 16, 2015

Ponzo and MoDX weekly Updates...05.15.15

The updated Ponzo and MoDX charts are attached. What started out as a weak week turned out to be a happy resolution for the bulls. We'll note that Tuesdays following OPEX have often (70%) of the time been bullish days.  I'm sure there some convoluted arguments for this phenomenon but I just accept it at face value and factor it into my game plan.
Note that on balance the VDX and Ponzo forecast are bullish....and quite so.  This is an unusual forecast for the summer months, which are typical dull or down but again, that's what the charts are indicating. Monday I'll post the QQQ's ponzo, which is even more bullish. Market enthusiasm is supposedly due to the Europeans finally get their QE program into gear and hopes for China although there's a large body of thinking that China's a big risk for the next year. or longer.While these forecasts could be dead wrong they remind me of the Mauldin round table video I posted a couple weeks ago in which they suggested that your trading plan should not only be risk mitigated but also ready to profit from a breakout to the upside.


Thursday, May 14, 2015

Room to Move....05.14.15

A nice day for the bulls with the NYAD opening above 4 so we were essentially guaranteed a green day. The ergodics and ADX were in sync today, contrary to the past 3 days, and reflecting net buying in lieu of arbitrage flutter.  The daily TrendX suggests there's more upside potential left and the weekly Ponzo and ADX updates should be interesting.  The XIV was also in sync with SPY, again something of a technical improvement from the previous days this week.

Wednesday, May 13, 2015

Treading Water...05.13.15

It looked like a bullish breakout this morning with a nice gap up but early enthusiasm faded throughout the day with the indices finishing in the red after a steady and relentless reversal.
Volume was thin and the NYAD finished basically neutral. HFT activity was evident once again as the early pop to R1 was gradually eroded back down to yesterday's close (solid yellow line).
Frustrating? Yes.  Today's comment from the Schwab Alert service is attached below.

Tuesday, May 12, 2015

Ponzo QQQ Bullish Forecast...05.12.15

I been fooling around with the Ponzo Time Machine model recently based on its uncanny ability to forecast the short term path of the markets for the past 2 years.  I've added some of the Mosaic momentum routines to further filter the historical data and deliver a support/resistance forecast looking out 14 to 60 days. Note that I've added the strike bands for a 60 day butterday for option players.  I've talked about the butterfly before, a 3 leg option play with absolutely defined risk.
What is surprising to me is the rather over the top bullish scenario forecast by the Ponzo.  Keep in mind this model looks at what happened during the past 25 weeks over a 25 year lookback and then projected the most likely historical repeat for the next 18 weeks.  Just something to consider.


Monday, May 11, 2015

Technical Soup...AGAIN....05.11.15

It sure felt like a downtrend day but the indicators were in a constant state of confusion today.  The nice ergodic/ADX alignment we saw last week was replaced by the more familiar divergence pattern suggesting heavy HFT involvement.  Volume was very thin today but that's likely to pick up as we get closer to Friday's option expiration.

Friday, May 8, 2015

Ponzo Updates, New Small World model, etc....05.08.15

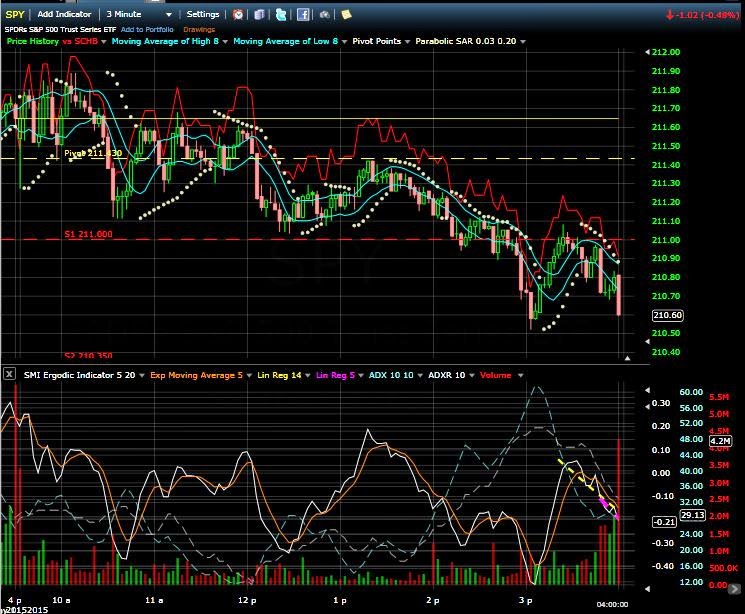
A bullish pop today with the NYAD soaring to 10.75 at the open Happens less than .5% of trading days).  We still have almost 40% of the S&P yet to report earnings but the expected May rain clouds are hard to find.  Today's closing action on the SPY matched the previous 4 days...very heavy volume on the close...today it was 8 million shares in the last 3 minutes. Also of note>> like yesterday the ADX stayed in sync with the Ergodic, suggested real accumulation, not just HFT scalping.
Here's the new Ponzo 18 week forecast and VDX.  Note the skew switch to the negative.
Below that is a screen shot of the new Small World model.  Why did I create this model?
One compelling reason is the latest from Mauldin Economics, (I have no $ connection with this outfit....I just respect their work).
Now I just have to figure out how to market the Small World model.


Finally, the new Small World model.  There's a unique method behind this model which be will discussed in next week's posts. The max drawdown over 2 years is an impressive 1.2 % and the linearity of the equity curve is equally attractive.


Thursday, May 7, 2015

In Sync Today...05.07.15

The wobbly pop at the open was our cue to cover any short positions and the 7;15 AM ALERT to close SDS at par avoided an otherwise 1.1% loss at the close.
Otherwise, today's action was unique on several fronts.
First. this is the only time over the past 2 weeks when we have seen the short term chart (5 minute bars) with the ADX and the Ergodic indicators in sync, which suggests there was less HFT manipulation than normally seen and that the recorded buying was in fact real accumulation. That's bullish.  At the same time, just like yesterday we saw a substantial volume surge in the last 15 minutes.  Today's SPY volume stood at 66M at 12:45.  15 minutes later it was 88M.  In fact, most of the action was in the last 5 minutes...and looking at yesterday's close we see the identical pattern.
Keep in mind tomorrow is Friday so the odds favor the bears and M# and LM are in cash.

Wednesday, May 6, 2015

Late Day Reversal...Will it Hold...05.06.15

Another down day with the VIX now sitting above 15 for the first time in a month.  VIX almost hit 16.50 90 minutes before the close, then dropped dramatically into the close.
 SPY volume was 135 million (average is 120 M) and more than 40% of that action occurred in the last 2 hours as buying developed. The XIV/VIX inverse correlation was almost perfect...something we haven't seem for a while and Thursday may be a good candidate for some buying follow through. Then there's Friday...typically a red day and a dangerous time with a possible Trap Door if the sellers decide to show their hand.
M3 has been a bit confused by the recent whipsaws but its continued cash stance has worked well so far.

Tuesday, May 5, 2015

Downpour...05.05.15

We were expecting a little rain but today's fizzle was an across the boards downpouring of equity.
We're gradually realizing that watching the action of the XIV can provide an important telltale warning of impending price changes.  We noted XIV's divergent action in yesterday's afternoon session and we saw that that played out dramatically today.  Looking back on past days when the XIV has closed contrary to price momentum reveals that this is actually an important performance to track.  We do this already in the XIV premium chart on M3, but this is daily data, whereas I'm suggesting that looking at hourly or 130 minutes bars might provide a valuable fractal version of the XIV premium charts.  More to come on this promising indicator in future posts.

Monday, May 4, 2015

Bullish with Chance of Rain....05.04.15

A nice pop at the open realized our expected follow through from Friday's close.  There was some pullback in select issue and evidence of ambivalence throughout the day.  Volume was very low and there was no trend conviction.  We still have almost 50% of the S&P yet to report earnings, including whole sectors, including retail.  XIV looked like a runner today then pooped out in the afternoon sessions and actually finished in the red (-.3%).  That's not a good sign for the bulls.

Saturday, May 2, 2015

Ponzo and VDX Weekly Update...05.02.15

Here's the Mosaic Ponzo charts for the coming week.  Odds are looking bullish from a technical standpoint as supported by the LM model.  These signals are of course no guarantee for actual results but at least indicate the current skew.
Here's a recent round table video of Mauldin advisors, guys for whom I have a lot of respect (no financial association).  The interesting takeaway from this video was the idea of being prepared for a breakout to the upside...an idea that you seldom hear discussed.