Monday, September 30, 2013

WORLD Update...9.30.13

With the govt. shutdowm looming and the odds of a last minute resolution dimming I thought it might be interesting to see what going on with the World model.  A bit surprising perhaps but EWJ (Japan) has jumped into the # 1 slot.  I say this is surprising because EWJ usually tracks the momentum of XLF (US financials) but with a greater volatility.  At this point we are seeing a divergence apparently based on macroeconomic conditions. 
The TrendX indicators are close to going VESTED again, although for the time being the indicated portfolio status is CASH per the P6.

Past metrics have shown that the first day of he month is typically bullish (about 75%) but if the shutdown does happen we may expect a 2-3% drop in the SPY, which is what happened the last time this condition transpired.  That's the bad news.  The good news is that there's likely to be a blockbuster rally when funding is resumed.  The $64 question is, of course, when...and just an important....how bad can things get get before the shutdown is resolved.

One strategy is to buy some out of the money calls on the SPY out at least 30 days (which takes you to November).  This is just an idea and not a recommendation.

Sunday, September 29, 2013

Gamma Update...9.29.13

We've made a minor portfolio adjustment to GAMMA by replacing UUP (US dollar) with XLE (Oil).  This change nudges the volatility a bit more but also provides a nore viable array of potential medium term runners....the type of 2-4 week momentum surges that can really boost the bottom line while simultaneously requiring almost no position trading adjustments.

For now XIV continues to dominate the # 1 slot although all the stops indicate the model should have gone to CASH around 9.20.  Why is that????

One reason, and a condition of using XIV in any portfolio, is that the extremely high beta of VIX almost guarantees that in order for it to be suoperceded by another portofliio component that component must be showing extraordinary momentum and relative strength when compared against the other portfolio components as well as XIV. 

Looking at the previous #1 leaders EEM and EFA (now #2 slots) in the 30 day % return column of the variables illustrates this point.  The differential gains between EEM and EFA and the rest of the pack are substantial revealing the true momentum surge that was occurring during that time period.
Our job is to keep an eye out for the next component to gain a #1 ranking...it's may very well turn out to be a breakout winner although, unfortunately, past performance is no guarantee of future results.

Thursday, September 26, 2013

A Schwab Commission Free Model..9.26.13

Here's a little 6 component model using SPY and 5 Schwab commission free ETFs.  The algorithm is the same as the old 6 component VTV model so those of you who purchased that software can import these symbols and derive the same performance results.
The beauty of this model is of course the commission free deal from Schwab.  According to Schwab tech support you can't day trade these for free but on a day to day trading basis they are indeed commission free.
The old VTV model didn't have all these embedded money management stops but the new generation of Mosaic will be available in a couple weeks at a modest cost for those who want to take advantage of the TrendX and P6 risk management tools.
The 4 signals are currently in consensus with CASH ( as reflected in the 5 day return metrics which reflect a vested position.)

Wednesday, September 25, 2013

ALPHA Update ..9.25.13

First, here's a new companion Mosaic site featuring real time TrendX charts of a number of Mosaic model components.  There a lot of bandwidth here so it may take a minute to load and you may have to upload the silverlight plug-in if you haven't done so already.

Meanwhile the markets continue in a slow down churn, displaying the irksome "trap door" pattern along the way.   We're approaching the end of the month....typically a bullish window...and with short term overbought conditions prevailing the markets are due for a pop.  This may cause the classic short covering response thus further pushing the ,markets up for a few days..
Just keep an eye on the SPY and XIV short term TrendX charts. .

The ALPHA model is suggesting a VESTED position status may be near ....contingent of course on NO govt. shutdown and some semblance of peace in the Mid East.

Tuesday, September 24, 2013

CARS...A Market Barometer?...9.24.13

Here's an interesting little model that may be useful in determining the pulse of the economy and consumer attitudes.  The markets are a reflection of corporate profits, both current and anticipated, and car sales, rec vehicle sales and car rentals play an important role in defining spending habits.  Next to a home, vehicle costs are typically the next largest capital expenditure for most households...hence the current view.
We'll use the SPY as our benchmark and then look across a variety of the largest players:
We then apply the T11 platform and in this case use a top 5 sort.....why?...because as you will see from the variables array some of these have been stunningly successful over the past 2 years.  We also see greater volatility in all these issues relative to SPY and the current short interest on several of these is just plain scary.
Given the volatility profile of this portfolio the money management stops are crucial and, as suggested by the weakening equity curve above (blue line), the stops panel is currently in CASH.

Friday, September 20, 2013

It's a Small World...9.20.13

Here's a look at the Small World model...a 6 ETF version of the larger World model that requires less trading maintenance and which typically outperforms the SPY in the shorter time frames.
There are actually 7 ETFs shown here so that users can experiment with slightly different mixes.
Looking at various combinations using 2 of EEM, EFA and SPY can illustrate the robustness of the model.
For purposes of looking at a baseline model this is the mix that will normally be referenced.  Yes...all the ETFs do move pretty much in lockstep but there are also periods of weakness and strength in the various components and this is what we're seeking to capture.  The SPY is the shaded area price chart on the www.freestockcharts.com platform.
I've mentioned this so many times it should go without saying but...given the price volatility of the model components and the herd mentality pattern of the price charts the P6 and TrendX money management stops need to be observed and enforced.
Here's the model:
And a closer look at the metrics:
This is top#1 sort but users can experiment with a top#2 sort which also produces decent returns.

Below is the Stops panel and we should note that as of yesterday the TrendX 2 and the Pairs Momentum have both turned down slope...arguing for a CASH position.

Thursday, September 19, 2013

WORLD.. Again...9.19.13

Yesterday's mega pop int the markets was a bit of an overreach but certainty goosed the WORLD model even higher.  How much of yesterday's closing surge may have been due to panicked short sellers trapped in positions and desperate to mitigate even greater losses.  That notion was sustained to some degree by today's moderate sell off.  The technicals are still clearly in historic overbought territory so we're keeping a short leash on current vested positions.

Tomorrow we will profile the new SMALL WORLD model, a 6 ETF condensation of the larger World model and a real revenue engine that doesn't require extensive trading maintenance.

Wednesday, September 18, 2013

WORLD Leader Looks Toppy...9.18.13

The recently introduced WORLD model has been chugging along with EEM in the top slot for over a week. And the returns have been respectable when used in conjunction with a top 2 sort.
The current P6 signals still look strong but keep in mind that these models tend to give positions a chance to "breath" between trends, so there will be the inevitable drawdowns before a clear trend reversal signal kicks in.  The upside to this turtle like momentum signal is that the frequency of trading is lower.

Looking at the EEM chart in a more active technical platform we see evidence that a trend reversal may indeed be developing so our caution flag should be up.

If you believe that the markets do work in cycles then EEM is sitting at a historical overhead resistance level (red line) and the odds favor a possible drop down to longer term support levels (green line).
Just another set of indicators looking at pricing dynamics will help preserve your capital.

Tuesday, September 17, 2013

Pair Dynamics...9.17.13

I mentioned the MO2 pairs trading software platform before and some of its features are explained on the etfmosaic homesite.

Using the relative strength of each side of a pair trade can provide a valuable confirmation of momentum that is not evident by analyzing either the P6 slope or the TrendX.  If 2 heads are better than one, then 3 must be even better for trend validation.

In the case of yesterday's XLF model, C (Citigroup) was chosen as the pair component and, as can be seen from the charts display below, the relative strength relationship between these 2 issues can indeed provide some insight when considering the odds of a profitable trade based on current market dynamics:
These are the net results over a 6 month lookback and we have applied no time stop which, we can show, is a powerful tool for containing drawdown and avoiding capital dribble.
In the XLF / C pair we have looked at a convergent pair...that is both issues tend to move in sync with one another and our strategy is to play the strong issue against the weaker issue.

If we take a more holistic view and look at the signals generated by both convergent and divergent (issues tend to move contrary to one another) pairs with the similar focus pair issue (A), then we produce a more
reliable scenario for successful investing.  In the case below we use XIV (VIX inverse) and a divergent pair component (SH) and a convergent pair component to create such a probability picture:
To improve our odds even further we have applied a 10 day time stop for each trade even though the relative strength cycle for both pairs averages 28 days.
In future posts we'll explore more nuances of the pair analysis that make consideration of the current pair dynamics worth a critical look.

Monday, September 16, 2013

XLF Model Update..9.16.13

Here's a look at recent activity in the XLF component model.  Most recent winners have been AIG and BAC.  We're seeing a modest gain over SPY short term but the volatility is also higher so we have to watch those P6 stops.

The markets started out the day with the NYAD at 23!!!!!!!!!!!. Absolutely astounding and presumable based on the weekend pronouncement of a "deal" on Syria.  Not quite sure how much more juice they can continue to squeeze out of the Syria thing...its mostly based on hype and hope...not really the best investment criteria, but who cares as long as the bull run continues (except for APPLE, which has fared VERY poorly lately).
At a more technical level the TrendX and P6 suite of stops continues to support the vested argument although the model is approaching overbought levels.


Sunday, September 15, 2013

X Sectors May Be Topping..9.15.13

The markets have enjoyed a nice little run recently, but technicals are arguing for close attention to stops as overbought conditions continue to develop (note the SPY TrendX in the right side panel). 
Energy and materials have led the latest run as reflected in XLE and XLB, although the industrials (XLI) have been the recent surger.
Note the little equity curve (blue line) reversal currently underway on the 3 month chart...another sign that a trend reversal might be around the corner.
At a more technical level here's the view using the latest P6 series of charts based on the TrendX and a % change pair study of the SPY versus XLU.
The current pullback in the lower left TrendX chart (above) is one more indication of possible momentum weakness. 

There have been a number of queries about the pairs chart.....what does it mean and why should I care?
Next week we'll look at answers to those questions and more.  Basically, we want to see if the momentum leaders (and laggers) are exhibiting volatility patterns in line with historical norms.  If not, then we need to try and determine how the current skew may be of use in forecasting possible reversions to those norms.

Here's a snapshot of the current SPY/XLE pair over a 6 month lookback period using the MO2 analysis just as an example of the type of analysis I'm refering to.:

Thursday, September 12, 2013

More WORLD Views..9.12.13

As promised yesterday, here are a few more charts and analytics on the WORLD model.
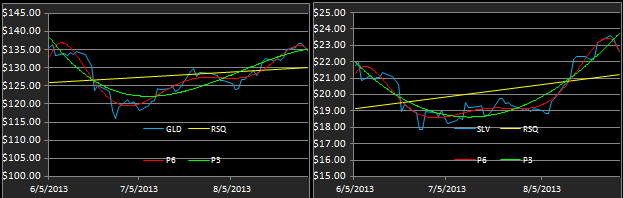
First, the 11 component charts.....and the thing to note is that virtually all of them are currently upslope, both with the RSQ and the P6.

This isn't always the case and when things do turn downslope the majority will follow in the motif of herd mentality....if it's bad in Germany the ripple effect will likely be felt in Australia.  Obviously this isn't a hard a fast rule...there will always be economic factors that give a momentum edge to one economy versus another and those differentials are a stellar investment window via the model.
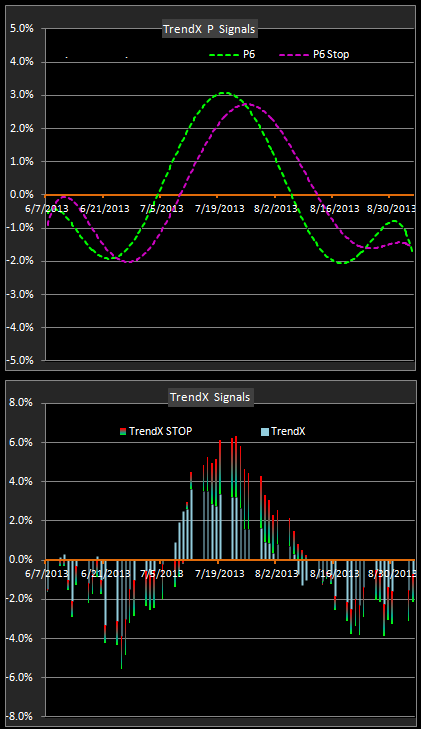
The other consideration of this herd mentality tendency is the need to follow the various P6 stop signals.
Using the various P6 permutations for confirmation its rather easy to identify the higher opportunity "sweet spots" and to avoid the black holes of drawdown.  Spending some time each day watching these signals unfold for a few weeks will either convince you that there's something there...or not.
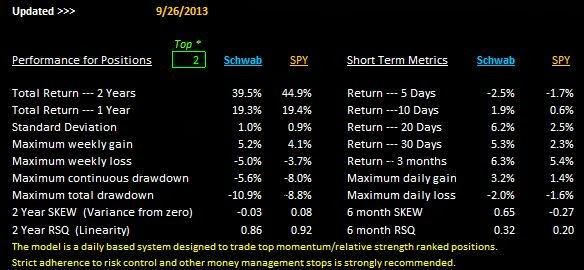
Then there's the performance results for the WORLD versus SPY, which is actually a WORLD component representing the US.  The World is clearly more volatile over the 2 year lookback...which accounts for the current great short term returns versus the SPY, but also emphasizes the importance of not dawdling with stops when momentum turns down.
Most experienced traders will tell you that pulling the trigger either in or out of a trade is not easy...which leads to a couple trading axioms that also apply to longer term investors:
1.  Anybody can get into a trade.....its when you exit that matters.
2.  It's better to be out of a stock (or ETF) and wishing you were in it than being in a stock and wishing you were out of it.
The various stops are your best friends, don't ignore them.

Wednesday, September 11, 2013

WORLD Model...9.11.13

On the anniversary of 911 I'm introducing the WORLD model, which will become henceforth an integral part of the T11 suite: ALPHA, X Sectors, DF (Default) and WORLD.  Our goal was to provide a variety of portfolios featuring the performance characteristics of disparate securities, assets and derivatives and in this regard the current lineup of portfolios provides a solid foundation. 

I have also developed a T6 version of the WORLD which I'm calling Small World and which will be detailed next week.  In the meantime, we'll look at some of the factors to consider when deciding which model offers the best short and long term prospects and how actively you want to trade in order to enforce the money management stops in order to avoid drawdown and enhance returns.

The actual model components have been revised to delete any currency related ETFs and the arguments for doing so are several.....which be be discussed in upcoming posts.

Here are the model ETFs and a few critical metrics that will be used to further examine the volatility profile of the model and (its the same old story) the need to enforce the P6 and TrendX stops.
We're missing a few countries here but the extremely thin daily volume and wide spreads of many of the country ETFs make them unsuitable for the retail trader to even consider as investment vehicles.
As with the ALPHA model the short term returns of the WORLD often exceed the SPY and reinforce the need for money management stop enforcement since the total returns over the 2 year lookback are skewed in favor of SPY.

This volatility can be see in the "Price Volatility" metrics in the ETF list...virtually every component has a higher volatility than SPY.  We just need to formulate a plan to take advantage of that volatility when its in our favor and avoid getting hit with drawdowns when volatility is trending against the SPY.

Tuesday, September 10, 2013

X Sectors...9.10.13

Continuing gains have put the X sector model on an upslope cross of the RSQ equity line although a quick check of the short term metrics panel revealed that SPY has actually declined a bit over the past 30 days..  The new P6 kiss is a bullish indicator and suggests further upside may be in order. 

Much of the recent market enthusiasm has been widely attributed to the delay in a Syrian attack that would produce consequences of unknown proportions.  This is a market that wants to go up...... but
We'll have to see how the President's message on Syria will be received at Wednesday's open. 
Best guess is that the markets will hold until there are actually missiles in the air...then...its anybody's guess.

Work on the currency/country model is proceeding and a full new T11 portfolio will be presented tomorrow.

Monday, September 9, 2013

A New Model (in progress)..9.9.13

The response to the new ALPHA model has been enthusiastic and several readers have asked if I could create a model that focused more on the countries and the currencies as an alternate tactical approach to trading forex (FX) (foreign exchange markets).  I use to trade FX on a daily basis using an overnight bracket order approach that produced steady and low risk returns.  I frankly don't know why I stopped trading the system since it required so little attention but these recent inquiries may be an excuse to revisit the FX markets and the safety of bracket orders. There are more than a few trading gurus who are forecasting major economic upheaval similar or worst than the 2008 crash based on the largely overlooked debt crisis.  Under such a scenario the value of equities and bonds would decrease dramatically, short selling would probably be restricted (as in the past), inflation would crush the value of cash, and one of the few opportunities for equity growth would be in the currency markets. Of course, this is just a few guys trying to get the rest of us really worried.
This new model is a work in progress and designed to focus more on short term returns (less than 90 days) in lieu of a longer term investment perspective.  The momentum ranking approach is still used but, as with the ALPHA model, paying attention to the stop signals is critical. As with the development of previous models I generally start with a larger basket of portfolio candidates and then track the winners and cull the losers in a momentum based model.  Such is the case here where we start with a fairly broad stroke portfolio and then create a couple 6 component models which are later combined into a larger 11 component version.
This is a blend of ETFs with just a few basic metrics like daily volume and price volatility defined to help see how thay might interact with one another.
And, as a first draft of a 6 ETF model, here's one portfolio (below) that has performed well on the short term metrics, but obviously underperformed the SPY longer term.  As I mentioned, this is just a starting point, but the results look very encouraging for creating a more robust and sustainable equity curve while at the same time looking at trading and investment opportunity through a different portfolio blend than either the APHA, X Sector or DF (equity/bond default models).  The model currently likes the China and Canada ETFs and has for quite a while (the duration of the recently upslope P6).

Sunday, September 8, 2013

Gold & Silver Prospects...9.8.13

Here's an update of Friday's closing signals on the ALPHA model, which has recently been dominated by the gold and silver ETFS...GLD and SLV.
The model has clearly been hit by the expected reversal in momentum following a dramatic parabolic (and profitable) rise.  The good news would appear to be that the metals are beginning to look oversold...with the P6 on the 3 month chart now below the RSQ equity line and the TrendX P6 signals approaching the zero line.  However, the word "beginning" must be emphasized.  Based on the behavior of these technical signals in the past we should expect continued weakness before a true buying opportunity presents itself in these 2 ETFs.
To confound these expectations Jim Rogers, arguable one of the greatest commodity traders of all time, recently voiced the opinion that gold is in for a more substantial retreat than most traders may expect and he forecast a possible low at the $1000/ounce level (currently around $1300).  As if to reinforce that forecast here's a recent article from FUTURES magazine that makes a similar look forward based on a supply and demand perspective.

Below is a composite chart that looks at the SPY (shaded area) versus SLV, XLU and GLD over a 2 year lookback.  Despite the recent rally that has produced nice returns for the ALPHA model the chart clearly shows that holding gold and silver over the past 2 years has not been a happy situation as they have both been in a steady decline with gold having lost 25% and silver having lost 45% of its value over that time frame.  The foremost conclusion to be drawn from this chart is that tight risk management is absolutely crucial in order to protect your equity in this model as we are really bucking the curve by making GLD and SLV our investment choices and the positions must be considered short term holds...not long term investments.

Thursday, September 5, 2013

X Sectors Remain in CASH..9.5.13

Despite the marginal rally effrots of the past few days the markets are not displaying any momentum trends that can be tracked with our models and CASH is still the P6 indicated position for all models.

A closer look at the X sector model shows it virtually neck and neck with SPY on both a short and long term basis...thereby revealing the lack of momentum in any particular sectors.  This is actually an abnormal situation and shows the lack of leadership and commitment of capital in the markets.
If we take a closer look at what the TrendX signals are showing for this model we are confronted with a distinctly negative view of the current momentum rankings.  This doesn't mean the rankings aren't working...what it means is 2 things:
(1).  The disparity between momentum strengths in the various components is very slight (no leadership) and
(2)    Remaining vested in the model rankings will mean that you will lose money slower than if the rankings had been ignored.


Wednesday, September 4, 2013

P6 Still Argues for CASH..9.4.13

The bounce today did stick better than the previous attempts over the past 3 days but the leaderboard was not uniform and once again we are in a period of selective momentum among stocks, making our ETF approach of blending risk a bit more difficult.

Over in the ALPHA model silver and gold took heavy hits, supporting the previous signals to seek the safety of CASH rather than trying to buck the new downslope P6 trend in the top 2 sort.

Here's a screen shot of the fuller graphics panel for ALPHA as well as a closeup of the 2 new TrendX charts.
The upper chart is actually the P6 signal of the TrendX and the P6 signal of the TrendX 10 period moving average.  The crossover of the two P6 signal lines is considerably smoother than the cross of the equity line and the equity line P6....with the intent of  easing the identification of practical money management stops.

Tuesday, September 3, 2013

Rally Fizzles, Again..9.3.13

The markets got a nice pop at the open but the NYAD was in steady decline for the remainder of the day.
The temporary reprieve from a Syrian intervention gave cause for some optimism but the odds are that sooner or later POTUS is going to pull the trigger and create some clear destabilization of the evil-doers.
While gold and silver rallied nicely the P6 signals are still in a reversal pattern with the equity line basically flat for the past few days.

Over on the X sector model here's a view of some of the new visuals designed to help identify appropriate money management stops. Needless to say...the signals are all arguing for CASH versus vested positions.

Sunday, September 1, 2013

P6 Stop Fires for ALPHA Positions..8.30.13

There were some updating problems with the Yahoo data since Friday although those now appear to have been resolved.  The models should now update through 8.30.13.

Friday saw a continued decline in the markets and parallel weakness in SLV and GLD and the P6 on each chart has now turned downslope....as was suspected in Thursday's post.
The metals have had a great run but the odds now favor a retreat to the RSQ line as a minimum.  Booking recent gains now and waiting for a signal confirming the next leg up is one money management tactic that will avoid possible drawdowns.
On the hybrid model which is now termed ALPHA we note the migration of gold off the top 2 sort while (surprisingly) silver is still in the sort.
It is at times like this that close attention to the larger P6 stop is important and we can see that an equity/P6 cross occurred on Friday and the 5 day metrics show that a top 2 sort drawdown is greater than our SPY benchmark...two strong arguments for cash positions.
For the Fall update to the program we have added a gradient based P6 signal to the 3 month chart to help identify trend exhaustion and reversal points as well as a gradient based TrendX indicator to be used a confirming stop signal that actually generates several degrees of risk exposure for closing vested positions as well as several impact points for possible new vested positions.
The platform is still in beta testing but a late Fall release is expected.