Monday, April 30, 2018

QLD Long for Tuesday....04.30.18

End of month is typically bullish (76%) so we may see a bump in connection with a Turnaround Tuesday scenario.  Earnings are generally great but geopolitical issues are increasing market risks (China, Israel, Venezuela, etc).  All models are long.
We closed our VIXEN /PVOL long this morning as QLD crossed from green to red so our metrics today are actually 1.4% higher.


Sunday, April 29, 2018

QLD Mixed for Monday...MR model surges...04.29.18.

Now siting on a technical support ledge the QLD is in a precarious position.  The fact that the mean regression model (MR) is out preforming the trend following and pivot based momentum models suggests dithering weakness that may or may not get resolved to the upside.
Also...keep in mind that the real life PVOL model is actually up 14% higher than posted metrics as we have the applied the nuances capital preservation tools of never allowing an opening  gain to become an intraday loss and taking advantage of buying/selling opportunities in the after hours market. (see April 7th post).
From a risk/reward viewpoint the cash position MR model looks like the best odds trade for now.


Thursday, April 26, 2018

QLD Mean Reversion Long for Friday...04.26.18

Amazon up over 100 points afterhours and QLD is up 2 %.  Our mean reverrsion signal for QLD remains long while the TF and PVOL models are in cash.  Its all in the earnings for now...
TrendX is bullish as volatility continues to erode..

Wednesday, April 25, 2018

QLD Mean Reversion Model goes Long....04.25.18

Once again we used our fixed stop cross from green to red to exit our QLD long position.  What was unique about today's trade was that it fired within the first 3 minutes of the market open.  In early trading the limit stop was hit and exceeded but we were out at that point with no worries. 
QLD did rally in the afternoon session and it looked like we had missed a nice green day but then it faded into the close with only a net .3% gain for the day.
Market is up big afterhours....QLD up 1.25%....so tomorrow may be rally day but then Friday is just around the corner with red odds improving.
I've mentioned this before but its interesting that the performance metrics of the VIXEN and MR models are so close given that the momentum algorithms generating the signals are diametrically opposed.  MR also has better linearity.


Tuesday, April 24, 2018

QLD Still Mixed for Wednesday...04.24.18

We lucked out with our little QLD trade today as QLD opened higher before crossing down through the zero line 15 minutes into the session...which triggered our fixed stop and saved us from a 4% loss sustained by long term holders. We are now 14% ahead of the posted VIXEN/PVOL performance values based on this simple capital preservation trade......never let a gain become a loss.
For tomorrow signals are mixed once again and although the QLD is up .5% after hours a lot can happen before the opening bell and the TrendX and Pivot charts do not look bullish.


Monday, April 23, 2018

QLD Still Mixed for Tuesday....04.23.18

Signals continue to be out of sync with both the VIXEN and PVOL TrendX charts bullish while the signals diverge (based of volatility sinking in the VIXEN). 
As noted in previous posts our actual performance metrics are now about 12% better than posted model returns as we apply additional capital preservation trailing stops and fixed stops (e.g zero line cross).   Today's early tepid action drove us to exit the small QLD position as it failed to penetrate the R1 pivot as the rest of the market was weakening.


Sunday, April 22, 2018

QLD Mixed Signal for Monday....04.22.18

We're in a technical holding pattern currently as the signals are not providing a synced signal.  We closed the little QLD position at the open Friday, saving a few bucks as the day wore down.
For Monday I've posted the TF (volatility trend following), PVOL (price and volatility hybrid) and MR1 (short term mean reversion) performance metrics.  Depending on how you cut it the TF model still looks the best in terms of win/loss but the MR model has much better linearity.
Checking the ATR and OC charts its clear that volatility is once again on the rise as P^ crosses above the RSQ linear regression line.  TF looks like the best technical signal with a modestly upbeat fast Alert on the TrendX but in this dynamic political environment anything can happen.


Thursday, April 19, 2018

QLD 50% long (cautiously) for Friday....04.19.20

We closed the open QLD position shortly after the open as our confirming indicators were all bearish. For Friday the signals are 50% long although all TrendX signals are negative and our general rule is to avoid long trades under such conditions. The position size has been scaled back accordingly.
Always better to be out of a position wishing you were in it than in a position wishing you were out.
QLD is down .20% after hours.


Wednesday, April 18, 2018

QLD Long for Thursday...04.18.18

Beginning to sound like a broken record but the signals are in sync and long for Thursday.  Earnings reports continue to drive positive momentum even in the face of deteriorating macroeconomic factors.  As always, we are ready to bail out of our positions at the slightest provocation.
BTY,... Amazon in up $28 afterhours after announcing prime membership has exceeded 100M.


Tuesday, April 17, 2018

QLD Long for Wednesday....04.17.18

The earnings juggernaut rolls on with (as expected) the biggest gains in tech.  Bullish momentum is still on the rise and we're long QLD moving into mid-week without any new crisis on the horizon


Monday, April 16, 2018

QLD 50% long for Tuesday.....04.16.18

The drop in volatility has caused the TF model to go to cash while PVOL remains long...still outperforming the TF volatility trend following algorithm.
Earnings will be in full force this week so being on the right side of the trade is extra critical.


Sunday, April 15, 2018

QLD Long for Monday...04.15.18

Our signals have come into alignment for the QLD and both are long for Monday.
Futures are +100 as of 8 pm Sunday.
The Syrian bombing apparently elicited no belligerent response from Russia or Iran so the bulls have the edge.
Note the rapid deterioration of volatility (ATR and OC charts) , which is why the PVOL model is outperforming the TF model.
.

Thursday, April 12, 2018

QLD 50% long for Friday (with risk constraints).....04.12.18

Signals are 50% LONG FOR Friday but the TrendX has crossed over to the downside in both models and that historically signals an impending reversal. The Syrian situation is still volatile and if we see overnight action expect red tomorrow.  Likewise for the weekend where the odds for something bad are looming.  We'll play is close to the chest and be ready to exit is things turned dicey.
QLD is down .5% in the after hours session.


Wednesday, April 11, 2018

QLD 50% long for Thursday (with risk overrides)....04.11.18

A whippy trading day as we await the outcome of the possible Syrian bombing and the developing Trump/FBI trainwreck. We bailed on our 50% QLD long troday once it got back to the zero line without violating our limit stop, so again, the actual metrics are better than those posted.  (see the weekend post for details). The markets could get volatile when Trump finally starts lobbing missiles and/or Israel lobs a few over at Iran.  Cash looks like a comfy strategy for the next couple days...especially as we get closer to the risk prone weekend.
The TrendX charts are not in sync.....getting cause for additional concern about signal reliability.
 

Tuesday, April 10, 2018

QLD 50% long for Wednesday....04.10.18

Same signals going forward.
Just a note:    when we say "50% LONG" that means that one or the other of the models is long.
The current metrics show PVOL outperforming the VIXEN in the past 5 days but that could change in a heartbeat.  As always, our primary concern is risk management and preservation of capital and playing volatility (Vixen) against price (PVOL) has so far turned out to be winning strategy.
Note that "best limit odds" have eroded from 3.5% yesterday to 2.9% today ...dramatically illustrating the rapid decline in underlying market volatility in the Qs although the ATR and OC charts still demonstrate an upslope RSQ while the P6 is clearly downslope.......looks bullish.


Monday, April 9, 2018

QLD 50% long for Tuesday

A rousing open gradually deteriorated to a near reversal at the close, leaving many issues near or at the lows of the day.
For tomorrow the PVOL is long and the Vixen is flat...same as Friday's closing signal.
Hope you had a chance to review the weekend post and the trading nuance tactics.....they work!


Saturday, April 7, 2018

Lessons Learned and QLD 50% Long for Monday....04.07.18

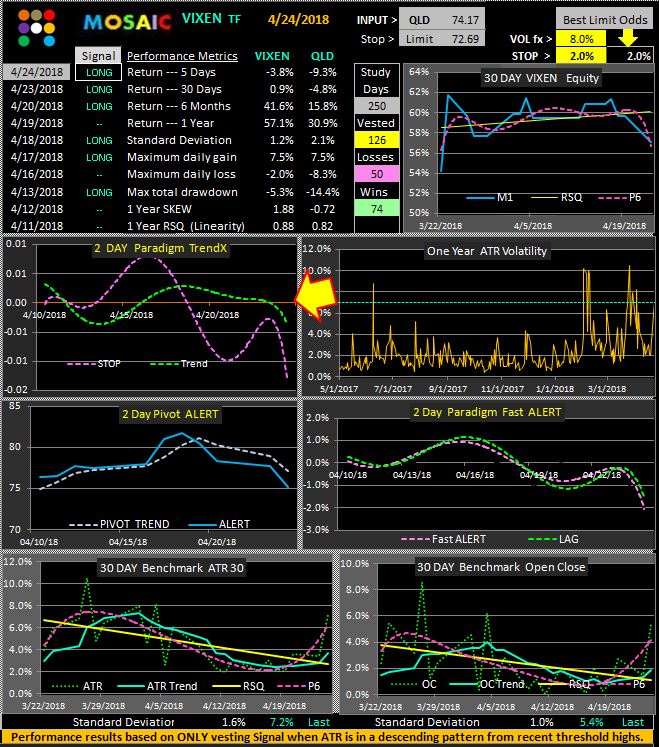
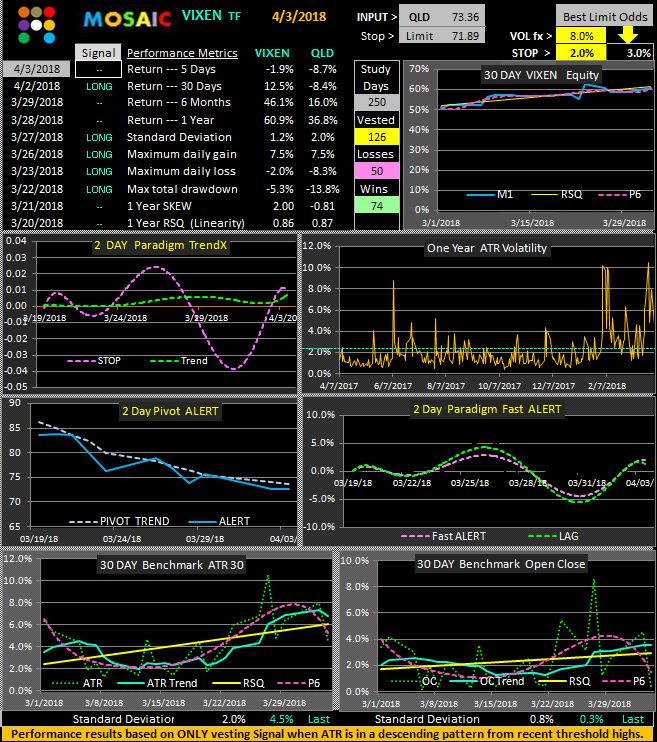
Below are the performance metrics for the VIXEN TF on the QLD.....without the benefit of our risk management rules which have actually produced a 4% higher return over the past 5 days and a 10% higher return over the past 30 days. 
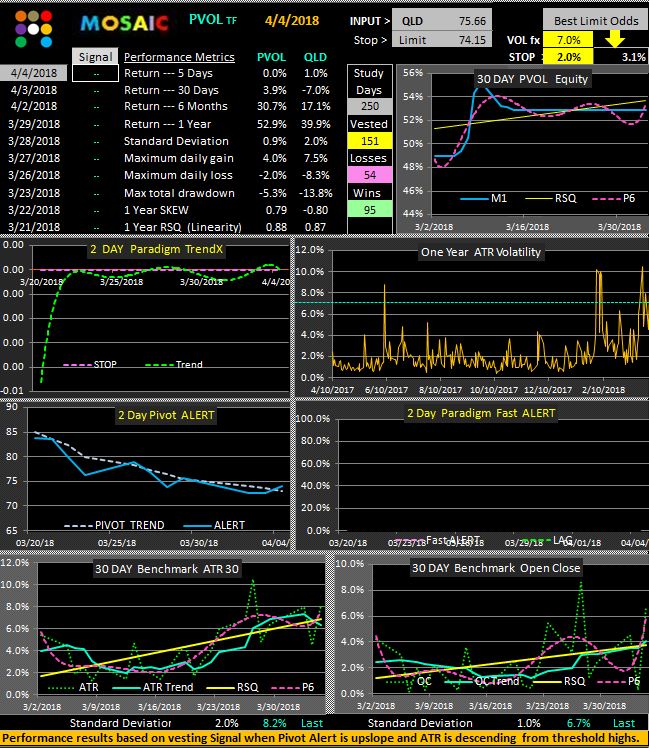
FYI..note below the accelerating ATR and OC volatility charts...and the "best limit odds" have now risen to 3.2 % ...up 50% in 10 days.
Let's review these simple risk management tools to safeguard our capital >>>>
1.  Never let a gain at the open become an intraday loss.  If the position opens up in the green then immediately cancel the limit stop and place a fixed stop loss at the zero line (or higher) or place a trailing stop at 25-50% of the limit stop % to preserve those gains.
This assumes you are able to monitor and trade the open for any active positions..
2.  Trade in the aftermarket hours (1-5 PM PST).   This works for liquid stocks and ETFs that have relatively narrow spreads.  All brokers require that any afterhours trades must be entered as limit orders (not market orders) and this is to prevent you the trader from being scalped by afterhours market makers. A lot of news happens afterhours (like earnings and govt. policy news) which can move the markets dramatically in either direction. In this high volatility market environment where 500+ point swings are not uncommon having a better heads up about the following opening dynamics can be a real money maker/saver.  This was certainty the situation in the Thursday afterhours session where both VIXEN and PVOL had signaled new long positions at the close.  THEN, mid afternoon Trump announced another $50B in trade tariffs with China and the DOW immediately dropped 400 points with the other indices following suit.  This was our cue to not enter the QLD on Thursday...thus saving us a quick 2% or more. This was a gift and I often delay entering or closing positions until 4:30. or later.
BTW...most platforms allow you to chart and monitor afterhours momentum using technical tools.

Thursday, April 5, 2018

QLD Long for Friday...04.05.18

A tentative rally today, especially in the financial sector, although the close was weak and volume was a bit subpar given recent volatility.  For tomorrow the PVOL model has actually generated a Long signal...the first one in 2 weeks...and that's mostly based on the positive action of the Pivcot Trend chart which today crossed into positive territory. The current TrendX charts support this bullish view and the VIXEN trend following model is in sync.  Barring some unforeseen new calamity the runes are risk on for Friday.


Wednesday, April 4, 2018

QLD 50% Long for Thursday...04.04.18

Despite today's huge turnaround from -500 to +200 Dow points the PVOL model remains conservatively in cash.  The TF trend following volatility model is more bullish and has shown better returns (although lower odds) returns over the past year.  I am concerned about the doenslope cross of the TrendX charts...both the 2 day and the Fast Alert and am scaling back position size accordingly.  In the past this TrendX downslope crossing has been consistently correct in predicting trend behavior...which in this case is negative.... and being the risk adverse creature that I am my strategy is adjusted accordingly.


Tuesday, April 3, 2018

QLD flat for Wednesday....04.03.18

Funny thing happened after hours yesterday... the VIXEN TF went long. We typically don't see signal changes after the close but that's what happened.  Based on today's QLD action any reasonably adverse trader (see 5 minute chart for the day below) would have bailed any longs early onat the pivot cross, but thanks to the traders still clinging to the buy the dip strategy the Qs and other indices finished in the green.
Was that Turnaround Tuesday? or just bottom fishing before the Trap Door opens. 
For Wednesday QLD is flat although the SPLV signal which I use as a confirming indicator in actual long...so it's anybody's guess.  Good luck out there.


Monday, April 2, 2018

QLD flat for Tuesday....04.02.18

Our flat signals for Monday kept us from some nasty drawdowns that would have broken through the limit stops ans cost us some big bucks.  We might expect some reaction rally tomorrow but these are precarious times with the breaking of key support levels and old timers like myself are in no mood to try and catch a falling knife.  Worst is the dreaded TARP DOOR reversal from apparent recovery strength that then results in new lows...sometimes dramatic new lows.  Caveat emptor.
Note that the current limit stop % value has more than doubled from last week.
We are flat for Tuesday.


Sunday, April 1, 2018

QLD Flat for Monday....04.01.18

First for the month typically bullish (>72%) and there appears to be no bad news looming...for now.
Nevertheless QLD is flat in both models and just just wait for a higher odds situation before jumping in again.  Major earnings are still a couple weeks off, the FED has shot its wad and we're left with a "no news is good news" momentum.