Wednesday, August 31, 2016

Some Trading Alternatives....08.31.16

Last day of the month and the markets are nervous.  If we don't see a bounce tomorrow that could be an omen of more downside to come.
As part of the MVP rollout we've been developing a portfolio of  trading alternatives focused on the foreign markets, where volatility is actually more predictable in many instances.
Currency trading is generally something stock traders don't latch onto but our goal is to trade what works and where risk can be identified and managed and from that perspective the recently developed MVP country and currency ETFs could provide a useful complement to US based ETF index trading. Not all currencies work well...the Canadian dollar, the British pound and the Brazilian real do not respond to MVP analytics and the Swiss franc does so only marginally.
However. those currencies that do respond to MVP analysis are worth noting.
We're also analyzing various country based ETFs for the same technical reliability and EEM (Emerging markets) stands out as a clear winner.  Huge daily volume, a robust option chain and narrow spreads.make EEM an ETF to keep an eye on.

Some Trading Alterbatives....08.31.16

Last day of the month and the markets are nervous.  If we don't see a bounce tomorrow that could be an omen of more downside to come.
As part of the MVP rollout we've been developing a portfolio of  trading alternatives focused on the on the foreign markets, where volatility is actually more predictable in many instances.
Currency trading is generally something stock traders don't latch onto but our goal is to trade what works and where risk can be identified and managed and from that perspective the recently developed MVP country and currency ETFs could provide a useful complement to US based ETF index trading. Not all currencies work well...the Canadian dollar, the British pound and the Brazilian real do not respond to MVP analytics and the Swiss franc does so only marginally.
However. those currencies that do respond to MVP analysis are worth noting.
We're also analyzing various country based ETFs for the same technical reliability and EEM (Emerging markets) stands out as a clear winner.  Huge daily volume, a robust option chain and narrow spreads.make EEM an ETF to keep an eye on.

Tuesday, August 30, 2016

PONZO Updates and MVP sample runs...08.30.16

Turnaround Tuesday is living up to its name with a single 5 minute up bar at the open followed by a steady erosion of price throughout the day.
The newest Ponzo updates have become bearish in outlook and are punctuated by a bullish forecast for the VIX, suggesting the narrow range trading of the last 5 weeks may be coming to a conclusion.
As always, we'll just try to decipher the data one day at a time and assess the odds accordingly.
I've added an MVP sample tab on the website to showcase some recent studies of both the momentum and mean reversion modes.
Purchase details of the software can be found on the  M3 site CONTACT tab.


Monday, August 29, 2016

More MVP Setups....08.29.16

The bullish edge for the markets predicted this weekend has materialized so far and and with modestly increasing volume,  which is a reinforcing signal. TLT has gone from oversold to overbought in a single day and is once again poised at the upper Bollinger Band reversal threshold.
Odds are high this trend will continue to Labor Day.
MVP availability kicked off this weekend and for the next couple weeks will be the topic of  our discussions.  We're containing to build a library of high probability setups and have a suite of foreign based F and E series ETFs that will be profiled tomorrow> FXE, FXI, EFA, EEM, EWJ. .... all big volume movers (except FXE) that offer attractive risk/reward profiles when compared to many US based ETFs.  For now, here are the XLI (SPDR Industrials) and IWM (Russell 2000) VPM momentum models with the volatility filter turned on.
Click on screen shots to enlarge>>


Sunday, August 28, 2016

VDX Updates and MVP...08.28.16

This week's VDX updates suggest volatility may become a bigger factor this week.  The narrow range VDI+/- channels that we have followed for the past 3 weeks are showing signs of  breakout.
With earnings season largely concluded and the FED doublespeak on Friday a distant memory in most traders minds the major market influences now are seasonality, the yield curve and the elusive X factor that drives intraday volatility.
The only significant data anomaly last week was Friday's volume...double that of the previous 4 days, accompanied by a severe FED inspired reversal....and a strong endorsement for trailing stops via our delta neutral model.
Next week is end of month, + Holiday = appx 80% odds for the bulls.....but anything can happen.

The new MVP is now available on M3. in the software section.  There are quite a few links to recent MVP explorations or you can send me questions for more details. My posting focus will be on MVP for the next few weeks and then sales will likely be suspended per my earlier posting.
MVP is now configured as a complete stand alone product with no need for a M1 signal supplement.
I will continue with my previous "MVP Basket" study discussions next week and beyond.


Thursday, August 25, 2016

The 5 Minute Difference...08.25.16

Regular readers know I frequently use 130 minute bar charts, especially with the Bollinger Bands, for support and resistance cycle studies. To ratchet down those views I also use 65 minute bars...not hourly bars...because the trading day is 390 minutes, not 360 minutes, so hourly bars give a distorted price/volume perspective.  Most trading platforms permit setting the bar charting interval to 130 or 65 minutes  And there is a difference in the signals generated...sometimes a big difference.
Below is today's chart update for TLT... first with 65 minute bars and then 60 minute bars.
Keep in mind there are more 60 minute bars than 65 minute bars with the chart s each set to a 100 bar lookback. As a result the lower 60 minute chart has been set to 115 bars to keep the 2 charts in phase..
Yes...there is a lot of nuance here but note the closing bars in each chart today as well as the offset in the Bollinger Bands.


Wednesday, August 24, 2016

GE Update....Avoiding the Opening Gap Trap...08.24.16

Back on the 15th I posted a GE bracket trade setup based on a tight consolidation pastern.
Here's an update on that narrow channel and rather surprisingly we're still midline in the channel.
(The up/down arrows and bracket values were established on the date of the original post).
On Tuesday morning's opening bar GE actually broke the upper bracket threshold but fell back into the channel within 15 minutes. Since I don't take entry trades for the first 20 minutes of the open I avoided being sucked into an otherwise losing trade. The opening pop was most likely the product of a prop shop opening range bracket order ...one of the most lucrative setups that deep pocket shops use to mint money day in and day out....which is why I avoid buying or selling the open.
I've also attached the current GE Ponzo forecast just to see if it offered some guidance going forward. This Ponzo outlook is one of the wildest divergent scenarios I've run across recently and the longer term bearish downturn (red line) does not appear to be an actionable play at the present time.
Bottom line......GE momentum is still in a wait and see mode and the chart still reflects one of the tightest channels of all the big caps. When it does break it is likely to be impressive.


Tuesday, August 23, 2016

PONZO Updates and Free Housing Opportunities For You...08.23.16

With short term odds favoring the bulls according to the Traders Almanac (thru Labor Day) here's the latest Ponzo forecasts. This bull skew is reflected in the SPY forecast despite September's penchant for being the worst performing month of the year. Both VIX and TLT  aren't giving us a lot to work with short term although both have new near term outlier scenarios that run out several standard deviations. Note that the timeline for the VIX pop corresponds with the SPY crumble...just something to keep in mind.
Now I know most of my readers lead fairly comfortable lives but if you're the ambitious type or maybe have kids that are looking to make their mark in the world here's a great new opportunity in urban homesteading in the beautiful heartland of America and the home of MoTown to boot.
I actually lived in Flint, Michigan for 18 months when I was attending GMI engineering school.
That was in 1963 (yes, I'm old) and Flint and Detroit were vibrant cities then, full employment, little crime, good black/white relations and everyone had at least 2 cars in their garage or driveway (all American made if you wanted to stay healthy). That ain't the way it s now....
_


Monday, August 22, 2016

TLT Perspectives and More...08.22.16

The new MVP price/volatility platform WILL FINALLY BE available this weekend.  I'm continuing to make refinements and integrate previous M1 algorithms with the price/volatility analytics to make the models more robust.
A tip of the hat to Bob H. and Andy K. who served as beta testers for MVP and whose combined 40 years experience in the fixed income markets has helped to make MVP a reality,
Below are the Mean Reversion and mean reversion MVP filter versions for TLT which continues to be my favorite trading ETF.(these are the full panels so you have to click on the charts to enlarge).

Immediately below is the 65 minute bar chart of TLT with the Bollinger Bands set 14/2.
Just like the 130 minute bar setup this simple support/resistance map has proven amazingly accurate in forecasting turns in TLT, especially when coupled with the RSI2.


Saturday, August 20, 2016

VDX Updates and Traders Outlook..08.20.16

No surprise that the VDX updates are all in neutral with the VDI+/- signal lines almost identical in all 3 charts.  The markets are stuck in this channel with little impetus to move up or down.  The low volume milieu continues even on the "big move" days, leading one to suspect that the HFTs are doing most of the volume these days and that if we discounted their contribution the true accumulation/distribution figures would be almost considered ill liquid.
Here's Schwab's Traders Outlook for next week....more consolidation expected.
And, just for amusement, here's Bloomberg's take on the worst stock market in the world.


VDX Updates and Traders Outlook..08.20.16

No surprise that the VDX updates are all in neutral.  The markets are stuck in this channel with little impetus to move up or down.  The low volume milieu continues even on the "big move" days, leading one to suspect that the HFTs are doing most of the volume these days and that if we discounted their contribution the true accumulation/distribution figures would be almost considered ill liquid. Here's Schwab's Traders Outlook for next week....more consolidation expected.
And, just for amusement, here's Bloomberg's take on the worst stock market in the world.


Thursday, August 18, 2016

Mean Reversion Still Tops for Bonds?....08.18.16

We're continuing to test the reliance of mean reversion versus momentum strategies on TLT...the 20 year Treasuries ETF.  For the past several months the 3 day mean reversion pullback approach has been highly reliable versus a similar 3 day momentum tactic. But now a new dynamic has emerged and I scratched my head over these metrics trying to decipher what they meant.  I suspect the parity of the 2 models is a function of the narrow range periodic cycling of the current market as reflected in the Bollinger Band studies profiled yesterday.
Note the behavior of each model along the 2 year RSQ equity line.
Also note the 30 equity curve of each model supporting our mean reversion preference for TLT.


Wednesday, August 17, 2016

Bollinger Bands Move Center....08.17.16

A quick look at the 130 minute Bollinger Band bar charts show out basket of SPY, VIX and TLT on a run back to the center line.  Tuesday's minor swoon was largely erased by today's dovish FED comments...a surprise to more than a few traders as the talking heads had been yakking up the increased odds for a rate hike sooner than later....but not according to the FED who still see weak economic factors to support holding off.  Volume remains about 50% normal and today's NYAD low of .42 should have been a signal that selling was muted and likely to reverse.


 130 minute bar charts courtesy of Schwab SS Edge.

Tuesday, August 16, 2016

PONZO Updates....08.16.16

This week's PONZO Updates are significant in the new views of SPY and TLT.  SPY has lost it's can't lose bullidh trajectory and TLT has lost is wild outlier scenarios.  Meanwhile the VIX forecast remains essentially the same as last week......muted and narrow range. Today's low volume breakdown may be harbinger of things to come as these pullbacks typically last 3 days+/- OR, if we see buyers stepping in tomorrow on increasing volume the odds are we're likely to hit that SPY 225 target despite the historical weakness in August and September.


Monday, August 15, 2016

MVP Going Prime Time...08.15.15

Here's a setup in GE that I like.  It's a bracket order that only enters long or short when GE breaks the 2 standard deviation band.. The narrow channel on GE is an historical anomaly and when it breaks it may do so with a vengeance. It looks like there's a potential buck either up or down to be made.
The remainder of the charts below show the performance studies of the MVP (volatility/price) model that will become available this weekend as a stand alone package of momentum and mean reversion versions.
The MVP momentum based charts featured today have the PCL filter turned on and show DIA (DOW index proxy ETF), IWM (Russell proxy ETF), FXI (China 25 ETF) and AAPL (Apple stock). The FXI chart is a door buster while the  Apple chart is the most amusing of this sampling and reflects the hare versus tortoise approach to trading.  Note the number of days vested in each study versus the sample total of 502 days......and then note the drawdowns..

MVP studies >>>>>>>>


Saturday, August 13, 2016

VDX Updates as the Channel Continues....08.13.16

This week's VDX updates verify the technical consolidation pattern constraining the current markets.
Each of our 3 studies is locked at the zero line and the VDI + and VDI- lines reveal the total lack of commitment from either buyers or sellers.  This point was emphasized by this week's SPY volume which hung right at 50 million shares/day, less than 50% of normal volume.
So how do we trade in this market with the expectation of an eventual breakout or breakdown?
1.  Delta neutral ....our default SSO/SDS model made money 2 out of 5 day this week with zero draw.
2.  Vertical spreads such as straddles.  The problem with the current low volatility markets is that premium decay is high relative to potential returns.
3.  Breakout setups.  Reviewing our Bollinger Band studies from earlier this week it's clear that TLT responds well to bands 2 SD wide. So we set up conditional entries 1.5 SDs from the midline both up and down....this is also known as a bracket order.  Just be sure to put a fixed loss and trailing stop or any such orders because reversals back to the midline can eat up your capital.
These are just 3 ideas.  I'm confident thoughtful traders have many more strategies appropriate to their risk comfort level.
If you haven't looked the recent M baskets studies they can be found here and here.


Friday, August 12, 2016

More TLT Perspectives .....Part 3....08.12.16

Hard to fathom this TLT volatility but there it is.  Our forecast yesterday for an impending bump in TLT kicked off today with a vengeance and in one day the technicals have attained and bounced off overbought status based on the 130 minute bar chart Bollinger Band study as shown below.
For further insight into the TLT cycles I've posted the M Basket study of TLT.  While not exhaustive, I've posted the most relevant templates to show how the signals perform. TLT is one of the most reliable mean regression skewed ETFs in my sample basket and the signal correlations have proven highly reliable. Note that these screen shots were of yesterday's close and despite the day's weakness all models forecast a vested position in TLT today.


Thursday, August 11, 2016

TLT yoyo Continues....08.11.16

The volatility in TLT is alive and well, recent good press to the contrary.  Actually, TLT is performing pretty much in sync with our 130 minute bar Bollinger Band chart that's managed to capture the bumps and dumps in this contentious ETF. We're now approaching the lower band so odds are getting skewed to the upside once the RSI readings start to turn up.
Following up on yesterday's post here's a look at the first M Basket with GE as the focus stock.
Over the next few days we'll post the current SPY, QQQ and TLT baskets with similar panels.


Wednesday, August 10, 2016

TLT Perspectives ..Part 2....08.10.16

Its well said that it's not only how you trade but what you trade that makes or breaks your bottom line.  I've opined for some time that TLT looked like a better trading vehicle than SPY if your main concern is risk management / capital preservation with equity appreciation a secondary goal.
Is the future of treasuries at all certain?  Not according to Monday's Ponzo forecast and we can quickly dredge up bond gurus managing billions with diametrically opposed views about TLT.
So as retail traders we have to accept that with so much international money vested in treasuries (China, Russia, Saudi Arabia. etc) its virtually impossible for the little guy to front run the treasury markets and we have to behave more like a speed boat tacking an aircraft carrier to maneuver quickly and avoid the drenching wake.
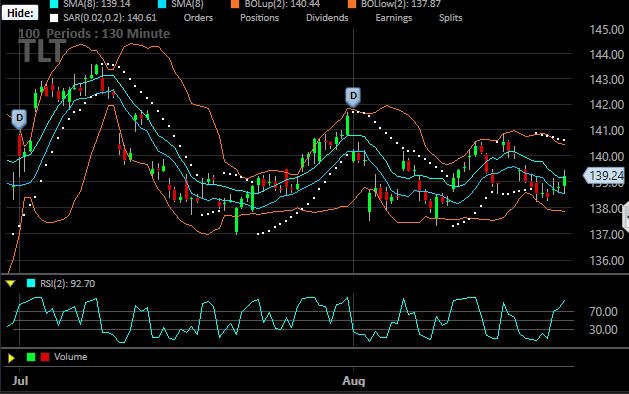
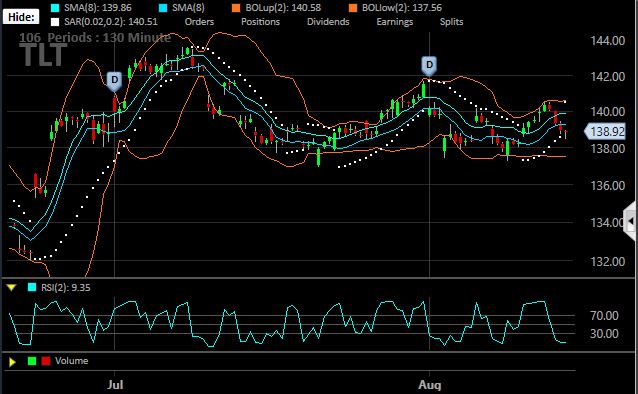
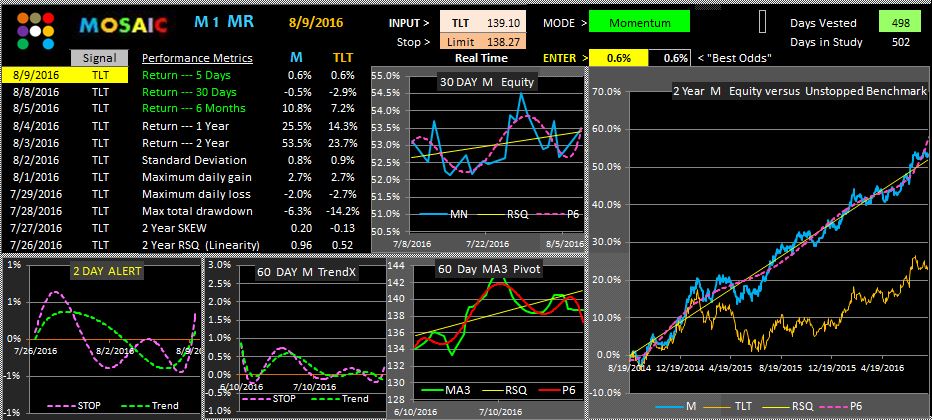
Yesterday we looked at how M1 looks at TLT data with a mean reversion bias to gain an edge and today we look at how the MVP ( Mosaic volatility/price) model tackles the same data using both a mean reversion and short term mean reversion perspective.
Once again its important to stress our prime directive...risk management as reflected in minimized drawdowns.  We quickly see that MVP doesn't spend much time vested in the trades but when the trigger does fire the results are quite reliable as shown in the comparisons of drawdowns and RSQ linearity.
While this approach doesn't appeal to everyone it does provide a steady capital appreciation with considerably less risk exposure than a buy and hope strategy.
Going forward ...in the next week or so I'm going to create several combo software packages focused on SPY, TLT, QQQ and perhaps XLE. Each one will include the M1 and MVP modules tuned appropriately to that ETF although users can easily change inputs, stop settings and volatility triggers. All programs include real time data that can generate pre-close signals.
Pricing is projected at $200 each or $350 for the bundle with free updates as they become available..
I'm only going to offer the packages for 30 days or so.
In the Fall I will have eye surgery that will severely limit my screen time for a month or so and I want to get user questions asked and answered before that hiatus.


.

Tuesday, August 9, 2016

TLT Perspectives...08.09.16

As SPY settles back into the Bollinger Band channel here's several views of the unstable TLT situation and how to best approach trading opportunities......mean reversion trading.
The  130 minute bar Bollinger Band indicates TLT is now in a rebound mode and the upside target is fairly well defined although we might see some backfilling along the way.
The M1 mean reversion mode provides a somewhat better idea of how TLT moves sporadically and how it responds particularly well to 3 day pullbacks (the basis for the mean reversion study).
Compare the results of the mean reversion study to a study which holds TLT full time but exits on days when the limit stop fires and then assumes a new position at the end of the day.
In the former case over 2 years TLT is held for 227 days and yields 39% with a 5.5% drawdown.
In the later case over 2 years TLT is held 498 days for a yield of 53% with a 6.5% drawdown.
In the <30 day timeframe the mean reversion mode outperforms and this is the trend we have seen over the past 6 months on a day to day basis.


Monday, August 8, 2016

Ponzo Updates Have Uncertain Forecast for TLT...08.08.16

This week's Ponzo updates continue the bullish theme for SPY and the low volatility theme for VIX but the TLT forecast looks very unstable with extreme bullish and bearish outliers at the same time, an outlook average that is bullish and a best fit outlook that is distinctly bearish.
TLT has been acting like a bug in a frying pan recently and any new positions should be small scale of hedged, a la delta neutral or using a longer term straddle IMHO.