Thursday, October 31, 2013

VEGA Sort Reverses...10.31.13

As suspected yesterday the markets took a turn for the worse today.  The bulls made a mid day push but could get the enough traction to hold gains into the close.

Tomorrow's the first of the month and a Friday so we may see some rebalancing positive action in spite of today's weakness.  The bulls still have a chance to take the lead, but there's increasing signs of overall waning momentum.

The VEGA model has completely reversed SSO and SH rankings in one day.  What is curious is SPY's non-decline to the #4 slot.  Friday's action should be interesting as the daily SPY TrendX (right side panel) is now in decline and all short term momentum signals are also negative.


Wednesday, October 30, 2013

VEGA Retreats...10.30.13

Note the developing hook on the SPY TrendX chart in the right side panel.  This has proven to be a reliable reversal signal in the past so it will be interesting to see if it pans out again.

To support this reversal we are also seeing a weakening of our ideal ranking alignment with SHY (our CASH proxy), starting a move to the left.

Two days of data have elapsed since the last VEGA post and we can see the short term ALERT has now crossed down through the P6 stop...signalling waning momentum in our #1 ranked SSO so open positions should be carefully monitored.

Arguing for the bulls is the typical Fall seasonal strength accompanied by the end of month bullish pop that kicks in over 70% of the time.  Does timing matter?
Arguing for the bears is a technically overextended market and some disappointing earnings and forecasts from medical, industrial and financial biggies.

Odds actually favor the bulls through the end of the year with a lot of eyes on a DOW 16,000.
This rosy scenario could be derailed at any time however by some unexpected crises that will get the worry beads working.

Alan Greenspan was on the Charlie Rose show last night and he said some very interesting things...among them that the prime emotion driving the markets is fear and the perception of fear...no doubt one of the reasons that bear markets fall much faster than bull markets rise. 
He had a few other nuggets of wisdom but I'll let you read his book to discover, if so inclined.


Tuesday, October 29, 2013

VEGA Update with 5 ETFs..10.29.13

Following yesterday's posting on the simple 5 ETF weekly model this is a look on how its working on a daily basis.  The momentum algorithm has been speeded up considerably to compensate for the higher beta of SSO and the resultant volatility boost means we need to be tuned in to impended momentum changes since the one issue that we trade...SSO...is an ultra bull. meaning for every dollar SPY loses SSO loses 2.  That's the bad news.  When the rankings are ideally aligned, as they are right now, the model churns out great returns.

In the next 10 days we'll offer a suite of 3 boutique ETF models featuring 2 different momentum algorithms and an array of new money management stops.  Check the Mosaic home site after Nov 1 for details.

Monday, October 28, 2013

Another Look at Weekly Models...10.28.13

Back in early August I profiled a market neutral model that off set SPY volatility with the SPY inverse ETF and a few bond related ETFs.  It's still chugging along basically keeping pace withe SPY but with considerably less exposure to drawdown. 
Since there are only 6 components we'll just profile a top 1 sort and regular readers should already have the T6 weekly software in hand so replicating these performance results so be a simply matter.
So you want to punch up the returns?  The price you pay is more risk exposure which translates into constructing a somewhat higher volatility portfolio. 
Since we want to be as lazy as possible about the whole investing process we'll simplify the portfolio by only making it 5 components...not the usual 6.
Just don't enter anything in the 6th Ticker input on the DATA tab and then hit the update button.
We've used SSO, the SPY ultra bull ETF and SHY, the short term bond ETF which basically reflect a cash position. 
Why do we even need SHY?  Just to show when bullish momentum is waning within the rankings.
Since there is no 6th input the 6th ranking slot will always be -- (vacant).
Our underlying premise is that if you believe SPY is bullish then ultra bullish SPY is the place to be since its returns are double SPY's.
 The ranking exhibited since 9/9 is the ideal bullish alignment...you just have be either be willing to handle the potential drawdown or be prepared to follow the P6 money management stop...which in this case has been upslope for the past 5 weeks.

Sunday, October 27, 2013

SMALL WORLD Continues to Grow..10.27.13

The performance of the SMALL WORLD model has been a pleasant surprise over the past 3 months although it has sustained considerable more volatility that SPY.....compare the SKEW values which are really volatility percentages.

The short term ALERT is now turning negative however and risk adverse investors may choose to scale back on position sizing or simply go to CASH until the next wave up.  After a run up of this magnitude its typical to see a retracement, at least short term.

At the same time the SPY/EFA pair, which historically exhibits a reliable correlation of % daily change has gone from a bullish divergence on 10.10 to its current situation which is fast approaching a zero cross. 
When and if that cross occurs the odds of a pullback increase substantially.

Thursday, October 24, 2013

VEGA Slows To Exit...10.24.13

Heads up on the VEGA all in model...we are seeing signs that momentum is waning and the P6 stops have fired a CASH position warning..  The model has done well over the apst 3 months but with the VIX back down to the low 13 levels there's not a lot of juice left in XIV to go much higher.

This suspicion is supported by the SPY TrendX chart in the side panel...but the markets has surprised to the upside consistently before so these fears may be premature.  Nevertheless, worth keeping a close eye on the exits.
Identical performance results can be attained by using the T6 model or simply entering only 6 inputs in the T11 model.

Tuesday, October 22, 2013

COMMODITIES Update...9.22.13

The Commodities model has been in CASH since early September per the P6 stop after a tremendous run in August that produced a 10% + return.  While other markets have been enjoying new highs and strong momentum the commodities have been lagging.

That may be about to change as the P6 has now turned upslope and the equity curve has turned positive.
Note on the 2 year comparison chart with SPY that commodities and SPY often move contrary to one another for weeks at a time.

Note also the position of the TrendX .  Do we have a setup that will repeat the August run-up? 
The only caveat is that the current leader is IYR...real estate...which is not really a commodity in the classic sense...so we may want to scale down exposure to this model until we get a stronger confirmation.

Monday, October 21, 2013

Small SCHWAB Model Update...10.21.13

Here's the update of the no fee Schwab model and we see its returns have been marginally better than SPY over the past 3 months.

The model uses a combination of a SPY proxy (SCHB), a real estate proxy (SCHH), a low volatility proxy version of SPY (SPLV), and emerging market proxy (SCHE) and an aggregate  foreign markets proxy (SCHF)... as well as SPY as a benchmark. 

It may be surprising,. but over a 2 year lookback period SPY has only held the #1 ranked slot for 5 days.
If nothing else, consider using SCHB is lieu of SPY for other models in order to take advantage of the no fee perk.

Saturday, October 19, 2013

SMALL WORLD Update... 9.18.13

We haven't looked at the SMALL WORLD model for almost 2 weeks so here's how equity fared during the govt. shutdown.  It actually performed pretty much in line with SPY although a closer exam of  the results shows momentum was concentrated on the first few days of the shutdown, which has gradually flattened out and which now looks headed for a pullback per the TrendX.

The point of using multiple portfolios of course is to rotate capital into those sectors or in this case countries that may be performing better than the S&P.

In hindsight its easy to say we just should have stayed vested,,,but there could have been a much different scenario than the current new highs and if that had transpired a vested position would be the last place anyone would want to be.

I thought I had created a nifty model using Fidelity no fee ETFs.  Unfortunately, it turns out that the highly touted Fidelity no fee offerings only refer to the buy side of the transaction and the program is geared towards longer term investors.  If positions are closed within 30 days transaction costs are assessed.
From this perspective the SCHWAB no fee offerings are much more attractive.

Thursday, October 17, 2013

VEGA Update...10.1713

Volatility is the focus of attention as the market readjusts to the funding and debt ceiling plans which really accomplish nothing except to promise a deja vu experience of this same drama come January and February.

What was truly surprising was the 10% drop in the VIX  accompanying a 100 point drop in in DOW at the Open.  Those 2 issues are supposed to work inverse to each othe,r not in lockstep.

The immediate conclusion to be drawn from that odd alignment is that not everyone saw the new "compromise" as anything worth cheering about and it will be instructive to see how the markets play out tomorrow at October option expiration.

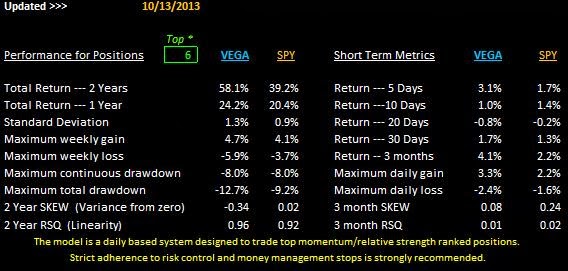
In the meantime, the VEGA all in model keeps chugging along and,  irregardless of whether the money management stops were followed or not, the equity curve has shown steady improvement. 
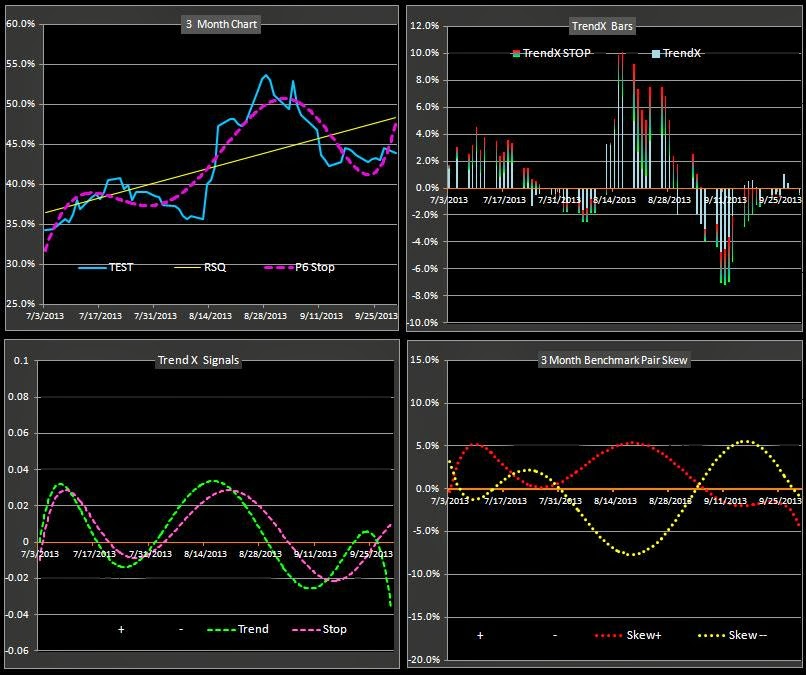
The 30 day TRENDX is suggesting that we're due for a pullback, likely greater than the one day gyrations we've seen lately.
I hope users have taken advantage of the TRENDX charts site...a link to which is provided in the User Reference section on the right side panel.
The SPY VIXEN and 5 minute SPY TRENDX have been very precise in forecasting the SPY's recent rise and fall and the live charts can be particularly useful for timing intraday entries and exits.

Here was yesterday's VIXEN set up as of 8:30 am PST (2 hours into the market).
Watching how the VIXEN reacts to the first 20-30 minutes can provide a strong clue as to how the markets will move until at least midday....in this case UP.

  Here's a shot of today's VIXEN as of 8:15 am PST..
We're seeing a divergence, but not a cross.  The implication is bullish but momentum is not in the go-go mode of Wednesday.
Here's an update of the same chart as of 11:30am PST..
I've captured the SPY 5 minute TrendX chart as well just to illustrate the alignment.
With this perspective of hindsight its clear that momentum was more bullish than the VIXEN led us to believe from the earlier chart.
On the other hand, it was much clearer on the TRENDX chart that momentum and price were on the rise.
Using these 2 charts together can therefore provide a 2 heads are better than one perspective and help confirm true price dynamics.

Tuesday, October 15, 2013

VEGA Fades, GAMMA Rises..10.15.13

Sometimes the technical algortihms know more than the left brain can digest. Today's weakness, culminating in a closing plunge were foreseen in the VEGA model and its trend reversal signals. In this climate of rising volatility there was little time for confirming signals and traders are advised to either stand clear of the potential gains and losses and just hold CASH....OR...be prepared to open and close positions quickly...which goes against the premise of the whole Mosaic concept.

While VEGA is fading the GAMMA model, with a more diverse base and wider sector exposure, has now gone positive with a focus on the international ETFs and XLU.....signalling an at least temporary avoidance of the US equity sectors. 

With Congress's deliberations stalled the economic picture is now very murky so extreme caution is advised unless time is available to pay close attention to market dynamics...and react accordingly


Monday, October 14, 2013

VEGA Continues,..but...10.14.13

The new all-in VEGA model was on the right side of the market at the close although at the open with the DOW at -80 it sure didn't seem like it was going to pan out that way.
The markets are still being whipsawed by the inability to get a long term funding and debt ceiling program and, bottom line, anything they come up with will likely be a last minute knuckle biter that will only produce a temporary fix for the current fiscal dilemma.

Looking at the VEGA results a little closer we should be concerned by XIV's continued ranking in slot 6 and thus displaying the slowest momentum.
Of further concern is the reversal of the 2 day ALERT and the little hook top on the 30 day TRENDX chart. 
The markets are currently overbought by most technical standards and although many are expecting a super rally when a funding package is finally approved we may have in fact already seen that rally in the past 4 trading days. 
We're due for a pullback.

Sunday, October 13, 2013

VEGA ALL IN...10.13.13

Here's a slight variation of the VEGA model that might be thought of as a VEGA bull with a hedge.
SH (SPY inverse) has been pulled from the mix and replaced with SSO (SPY ultra long).
This change gives us greatly amplified bullish gains WHEN THE P6 and TRENDX ARE UPSLOPE. 
To provide a modest downside buffer AGG and XLU are retained in the portfolio...which is always comprised of these 6 components. 

When its hot its hot..when its cold we're in cash. The first thing that comes to mind is probably "That's a lot of trades".  Actually...it's not.  The model tends to stay either vested or in CASH for extended periods of time so instead of frequent rotational trades we just trade the portfolio as a basket.

Depending on your broker and whether your trades are charged on a per share basis or a single transaction fee, managing the portfolio may turn out to be a lot simpler than watching the occasional periods of momentum whipsaws and rankings fluctuations.

There are multiple tactics to gain some peace of mind with a capital portfolio in volatile times like these...this is just one example.  It would be dream come true if we could create a no fee portfolio that would mimic these results and I've got some ideas in that direction that will be discussed next week.

Thursday, October 10, 2013

New 6 ETF Models...10.10.13

Hope springs eternal today as traders are betting that cool heads will prevail in Washington and we'll get back to business as usual.
Days like this are always instructive for short term traders since they provide a good look at where the buying energy (or short selling) is strongest and momentum is likely to persists for at least a few days.

In the meantime, while we wait out an actual resolution of the current financial squabbles, here is the suite of three 6 ETF models that can be plugged into the T6 platform.  I've talked about most of them already in previous posts but there have been a few refinements along the way and release of the new version of the Mosaic platform is fast approaching to help users identify money management thresholds.

Don't forget about the new TrendX charts site where you can track the short term performance of each of these 3 models in real time as well as check out the current SPY behavior.

VEGA...a volatility based model that uses a top 3 sort to better track underlying market momentum.

SMALL WORLD...benchmarked against SPY it looks for opportunities in emerging and foreign markets.

SCHWAB No Fee...also benchmarked against SPY it looks for opportunities in a select portfolio of Schwab commission free ETFs.  There are over 100 Schwab no fee ETFs but volume is tiny in all but a handful and these are some of the most active, with low spreads and quick execution.  Yes, you have to have a Schwab account to get the fees waived, but for smaller accounts the no fee deal makes a lot of sense.

Tuesday, October 8, 2013

WORLD Update ...10.8.13

Another down day with some nasty selling at the close...which is typically NOT a good omen for the following day unless the boys in Washington somehow regain their sanity and get on with the business of funding the government without the partisan politics that have hampered a solution so far.

At the open it looked like we might have a little buying but the trap door opened and it was all a guessing game from there.

Its important to keep in mind that there are extremely well heeled prop shops out there who can literally manipulate the market trend for short periods of time.  Don't believe it?  Believe it.  I've actually spent time with some of these guys and this is their bread and butter...pushing a stock up with minimal buying so they can sell a much larger existing portfolio of the stock...all at your expense.

Nothing personal...its just business...and the SEC can't do much about it.

Meanwhile the ripple effect of the US economy uncertainty is starting to kick in the WORLD model.
Although EWM looked like it was going to buck the trend the fact is that with today's close all 11 components ended in the red and all have downslope P6 money management stops except EWM...which is flat...so not an opportune time to get VESTED.

Monday, October 7, 2013

SCHWAB no commission model update..10.6.13

Here's an update of the little 6 ETF Schwab no fee model.  Using the T6 platform we note some superior short term returns although the model has now gone to a recommended CASH status.
Worth keeping an eye on when the TrendX signals turn positive.

Using only 6 ETFs also restricts our sector exposure and the trades then to run for a week or more without the need to adjust positions.

Sunday, October 6, 2013

GAMMA Update..10.6.13

The markets continue to churn as concerns over the funding block and now the impending debt ceiling cloud the economic crystal ball.  As in previous periods of high uncertainty the opportunities in the market are focused on individual stocks rather than portfolio momentum and as a result we are likely to see a continuing pattern of near hits and misses off short term support/resistance levels until the political morass becomes somewhat clearer.

The looming debt ceiling has extremely serious implications if not resolved in a timely manner.  The whipsaws that we are seeing in the equity and world models (ALPHA and WORLD) also extend to GAMMA, the volatility based model, where the extremes of the spectrum XIV AND SH have shifted their position in the #11 slot in a single day.  Meanwhile SPY continues to ride the #6 slot, the momentum fulcrum, further suggesting that it is the market outliers that represent the best investment choices for now.

With XIV out of the #1 slot we are actually seeing some equity line improvement based on EEM snd QQQ and the short term ALERT is close to a VESTED signal...but not yet.

Thursday, October 3, 2013

Watching the Mosaic TrendX Charrts...10.3.13

We're seeing more selling today as the NYSE advance/decline line hits 0.2...a clear bearish level (a value of 1 means equal advancers versus decliners). True worry levels display readings below .1 and can provide bottom fishing opportunities for the more risk loving investors and traders.

If you haven't had a chance to check on the new TrendX charts site you might want to see how these little thumbnails of market momentum can aid in confirming the P6 money management stops embedded in the models.

The main chart...a momentum divergence I term the "VIXEN", is particularly useful for shorter term traders looking to identify trend reversals.  The VIXEN will not catch the tops or the bottoms of  trend reversals but it will provide so called "sweet spot" situations that have a very high probability of success.

I've added the yellow arrows to highlight 2 recent divergence crosses. These charts are free and in real time (5 minute bars).  If you open the site each morning it will update in real time throughout the day without any need to refresh.

Wednesday, October 2, 2013

X Sectors Update...10.2.13

Today the selling has started to take hold as the talking heads predicted there will be NO QUICK FIX to the current funding deadlock.  This, of course, is pure speculation based on mostly gut feelings from a bunch of guys who have no liability for your capital account...and their forecasts should be regarded accordingly.

The markets continue to deliver a few surprises as the gllom and doom scenario sinks.  Ons such example is the momentum leadership of XRT (retail sector), while XLU (utiltities), which is generally regarded as a safe haven sector, languish at the far end of the relative strength spectrum.

As with virtually all the other models CASH is the current position status indicated by the various P6 risk management stops.

Tuesday, October 1, 2013

A Rally Surprise...10.1.13

Well...that was a surprise, but at least the statisticians were happy that the first day of the month was bullish.
Based on today's action we might wish for more govt. shutdowns to push the markets even higher.

OK...seriously...we may assume that short sellers had established overweight positions going into last night's failed funding conclusion. On a heels of merely moderate buying this morning the we can then surmise that many short sellers were likely squeezed into covering their positions, thus pushing the markets even higher....although the markets did manage to sustain an impressive net gain for the day volume was light.
At this point the markets have become a betting game more than an exercise in economic fundamentals and corporate metrics lending further credence to the model's CASH status.

This view is supported by the current state of the ALPHA model which is just biding time in CASH as we await the next bullish sector trend.  It certainty wasn't GLD or SLV, both of which were heavily hit in today's action, along with bonds.
The short term TrendX Alert looks more like a DNA sequence that a momentum guide and reflects the lack of leadership among any of the ALPHA components.

This "going no where fast" status of the portfolio is reinforced by both the pairs momentum study and the 2 longer term TrendX studies below.