Saturday, September 29, 2012

T3 Update...9.29.12

Following a volatile Friday session the T3 rankings have undergone a little adjustment for Monday's opening rebalance.

IWM has been kicked to slot #10 while TLT has climbed into #3.  Note that I've added IEF (bonds) back into the mix and kicked SHY.  Additional testing revealed that SHY volatility was extremely low.. in fact too low to provide an effective hedge against equity declines in the same manner as TLT and AGG.
If equities do start to crumble we're going to want as much strength in bonds as we can find and IEF provides considerably more potential that SHY in that regard. 

The SPY TrendX (right hand sidebar) indicates the current extreme oversold readings on SPY momentum and mean reversion theory would suggest we're ready for a surge up.  It was therefore interesting to watch the real time Tradestation MRSI and DB on Friday when they both flashed LONG signals on QQQ and SPY midday for about an hour before cancelling those signals in the last hour.

Those LONG signals were not active at Friday's close and no new Alerts were posted for Monday.

Friday, September 28, 2012

September Rebalance..9.28.12

The rebalance values as of noon today are shown above.  Earlier this AM you should have also received an Excel spreadsheet allowing you to calculate account size requirements and live ETF prices.

LM and TAQK Updates..9.28,12

Model LM and TAQK updates:
Note how bonds are gaining strength in the Momentum rankings in both models.
GLD has clearly been the catalyst for the LM model's superior equity curve although GLD is starting to show technical signs of needing a rest or a pullback.  Maybe the covered calls idea deserved another look at this junction.
The wild card to keep a close eye on is the SH (SPY inverse) position in TAQK.  If SH starts to migrate across the rankings the prospects for the equities side of the market are in trouble.  Although the TAQK model holds zero position in SH currently that may well change if it starts to gain momentum.


Thursday, September 27, 2012

T 3 Update 9.27.12

Thursday morning and no new ALERTS are firing.  Note how TLT has now moved into #4 position and XLU has following our expectation and also migrated across the matrix to #5 slot...a sign of underlying market weakness.
The model has held up well into the past few days of market weakness thanks to the weekend rotation into XLV (Health Care Spyder) and the stability of GLD (gold)...which have offset weakness in IWM (Russell 2000). 

T3 left some short term money on the table with the TLT exit ALERT on the 25th but that's the way the delta bands (DB) called it, so we need to follow the rules and post the signals.
Keep in mind that a yellow signal means both the MRSI and DB signals are Long.  However, if either of those systems produce an EXIT signal then the trade is closed.  In this case the DB system signaled a close while the MRSI was still Long.  Perhaps we should have just closed only 50% of the position, but that's the benefit of hindsight.
The TLT trade was still able to book 1.9%, so it was not all in vain.

Monday we'll take a look at a possible new addition to our ALERT signals, a tattletale called RCCI, which combines the oscillator forecasting abilities of the RSI (Relative Strength Index) with the CCI (commodity Channel Index). The system has performed steadily for years with the major indices so it may be time to include it in the ALERTS stable. 

Wednesday, September 26, 2012

TAQK and LM Updates ...9.26.12

Both models are experiencing a little pullback here although both are outperforming SPY.  The RM version of both models is still ON, meaning the positions are still in place and have not gone to cash. 
These are real time prices as of 8:00 AM PST so we may get some different results by the end of the day.  The last week of September is historically a terrible week for equities,,,which is the way it's playing out this year..so far. 
If the RM version of either TAQK or LM goes to CASH an email ALERT will be issued.

NOTE: 
The T3 model has not be posted today and there are no new ALERTS for that model. 
Tomorrow we'll look closer at the EXIT Alert on TLT issued Wednesday.


Tuesday, September 25, 2012

T 3 Update...9.25.12

 T 3's choice of XLV to move into the top 3 slots has so far proven to be a winner in the face of Monday's little wiggle.  GLD has regained almost 70% of yesterday's loss and still looks promising.

Note that we have an new exit signal ALERT on TLT this morning (on the Delta Bands) after a short and low return 5 day situation. If you would like to receive live email updates on future ALERTS please send an email to etfmosaic@aol.com and we'll get you on the notification list.
Some readers prefer not to be bothered with these ALERTS so we're just trying to respect their wishes.

XLU is showing some signs of strength in the matrix...which typically foreshadows a decline in the major indices so it bears keeping an eye on.

Tonight we'll email the sample Rebalance Calculator to subscribers (below).  It's a simple EXCEL spreadsheet that allows you to enter your account size and then calculates the correct number of shares for a current position in the TAQK and LM models.  The actual spreadsheet with updated prices will be emailed Friday morning and we'll also post a print of the rebalance values around noon Friday.
You can update the prices on the spreadsheet yourself if you desire.
Once you run the calculator you can compare your current model portfolio shares with the optimized number and make adjustments + or -.
The $25,000 portfolio is shown as an example only.
We'll continue to track the rebalance % for each position on the Newsletter postings of TAQK and LM to track how far out of balance the positions are running on a weekly basis but the actual rebalancing only takes place once a month in order to insure alignment with the projected equity curve of each model.


Monday, September 24, 2012

Time for Covered Calls? ...9.24.12

I'll delay the MRSI and DB studies for a couple days to deal with a recent query:
Several readers have asked whether this might be a good time to sell covered calls on the LM and TAQK models.

Covered calls are typically used as a means to lock in recent portfolio gains and with that strategy in mind certain criteria should be observed:

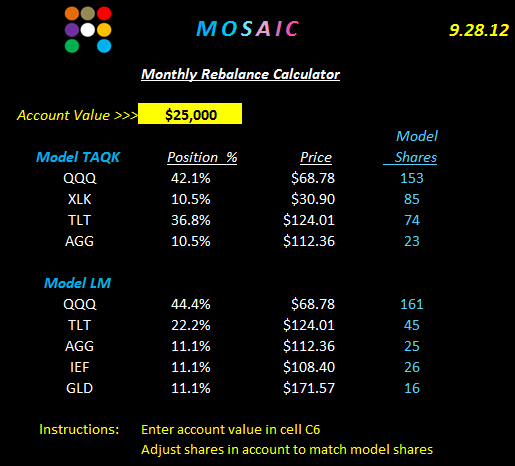
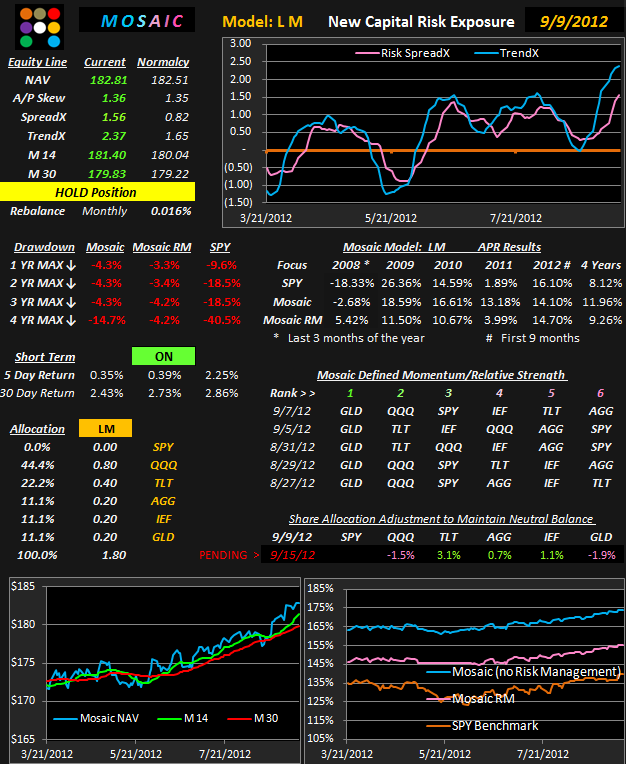
The LM ETFs are QQQ, TLT, AGG, IEF and GLD.
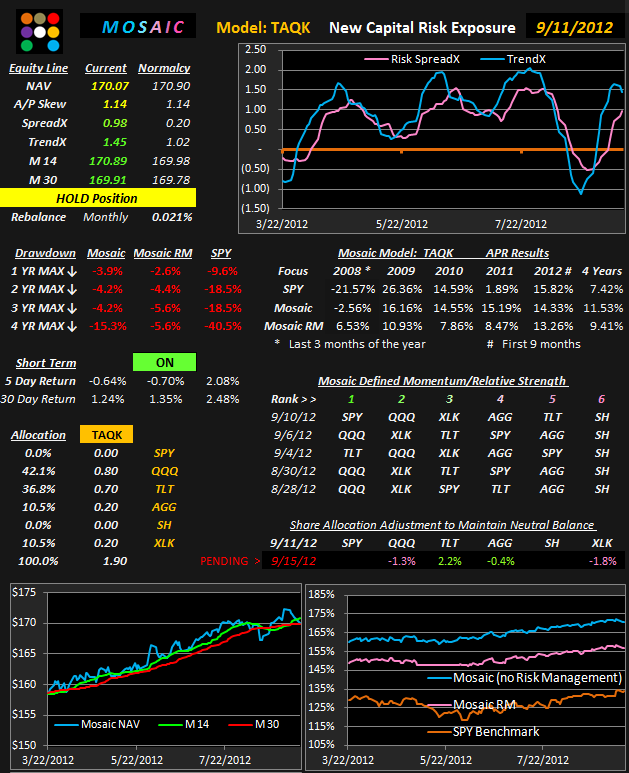
The TAQK model includes XLK, QQQ, TLT and AGG.

AGG has virtually no option volume so there's little opportunity there.
IEF has very thin volume and the spread tends to widens as volume contracts so we need to be careful with that one.  A slightly out of the money 1 month call is $.35 or about .32% premium..a trivial amount,a slightly in the money call is $ .90 or .8% premium.
QQQ has active volume, narrow spreads and huge open interest. A 1 month slightly out of the money call is $ .81 or 1.2% premium, a slightly in the money call is $ 1.41 or 2% premium.
TLT also has active volume and narrow spreads. A 1 month slightly out of the money call is $ 1.50 or 1.2%, a slightly in the money call is $ 1.97 or 1.6%.
GLD also has active volume and narrow spreads. A 1 month slightly out of the money call is $ 2.39 or 1.4%, a slightly in the money call is $ 3.35 or 1.95%.
XLK (TAQK model.. has thin volume and open interest.  A 1 month slightly out of the money call is $ .15 or .3%, a slightly in the money call is $ .64 or 2%.

Now, the tricky part becomes one of betting which way the market is going next.  If you think that equities are overbought and due for a pullback then selling the QQQ calls and or XLK calls are a great idea.
If you think the markets will run higher then selling TLT calls is the way to go.
GLD has been on a run for a while and is currently at levels seen a year ago, just before the retracement kicked in. Selling calls on the GLD position will lock in some of those recent gains and still allow GLD to climb a couple bucks without compromising the total return of the investment.

We've just got to keep in mind that LM and TAQK are market neutral models, designed to offset volatility by playing equities against bonds with a few wild cards like GLD in the mix.  What we don't want to happen is to have short call positions exercised and called away thereby exposing the portfolio to higher volaility (and drawdown) because one side of the balance equation has been eliminated. 
So how do you deal with that risk?
One solution is that when most of the premium has been squeezed out of a position, simply close the position, book the gains and then reopen a new ETF position in the proper percentage allocation (and possibly sell calls against the new position). 
The down side to this tactic is that it can end up looking like a dog chasing its tail and may incur a number of commission costs..
There are other tactical option strategies to offset the risk of exercise but they are beyond the scope of the current post.

Saturday, September 22, 2012

T 3 Update ...9.22.12

Both the MRSI and DB studies remain Long TLT...and we're up a few pennies after the initial entry Alert although we have to note that TLT is just not budging off that #11 slot...yet.

The big item of note is that XLV (Spyder Sector Health Care) has jumped to #2 slot.
XLE has fallen to #4...following a gradual decline in momentum from 9/17 to Friday's closing position (9/21).

For those keeping track, the entry rules for the T3 (top 3) system remain the same, Close the XLE position and enter XLV about 30 minutes after Monday's Open.   Keep in mind T3 performance metrics are based on holding equal dollar amounts in each three positions.  When the top 3 portfolio remains the same week after week those position values may change somewhat due to a different rate of appreciation in each of the positions.  Also, the net value of a share in each ETF will usually make it difficult to attain a true dollar for dollar position.  However, just keeping the positions as equal as possible will usually get the job done with minimal effect on total returns.

Next week we'll post some the the MRSI and DB studies in TradeStation format to get a better feel of what the odds of the trigger signals really are.

Friday, September 21, 2012

TAQK and LM Model Updates..9.21.12


The allocation adjusted version of the LM model continues a slow rises matching the SPY, although with reduced volatility.  To date the RM (risk managed) model is doing better than the standard Mosaic model...a bit of a surprise.  What's interesting is the continued alignment of the top 3 rankings...actually all 6 of the portfolio components are holding their respective slots.  This is the area to keep an eye on as any change in market momentum will show up here quickly.
The TAQK model is under performing the LM model, largely due to the GLD component in LM. 
TAQK has a  47% presence in bonds and LM has 44%, so that differential is minimal.   

Meanwhile,  TLT has so far not budged off the weak end of the ranking scale, confounding our MRSI and DB Long signals that fired in unison on the 19th. 

Based on this morning's opening it looks highly probable that the Situations T3 choice of XLE, IWM and GLD will hold through the close.  Saturday I'll post the T3 update for Monday to confirm that the pecking order remains the same.


Thursday, September 20, 2012

T 3 Update.. 9.20.12

T3 still likes the same top 3 as on 9/10 but equities are clearly stretched to the overbought side of the equation currently.  Note the behavior of the SPY - TrendX on the right side panel.  A dip is overdue.

In early going today (90 minutes in)  materials and energy are getting the fish eye so GLD and XLE are showing a pullback but the NYSE advance/decline line is rising, which typically indicates underlying buying rather than selling.
Whether this is a short term blip or something more substantial remains to be seen.

The TLT Long alert yesterday was reinforced by this morning's pop and the next confirmation of a possible trend change in bonds will be a movement of TLT from the #11 slot to something a bit more positive (remember XLE's recent excursion across the matrix).

Wednesday, September 19, 2012

TLT Alert..9.19.12

As of midday today both MRSI and DB signaled a Long opportunity on TLT.
This morning's T3 Situations post has been updated accordingly.

These Alerts are e-mailed and published for your information only to aid in tracking the performance of the SITUATIONS models and are not intended as investment advice or recommendations to either buy or sell specific ETFs.

T 3 Update ...9.19.12 (Revised)


TLT signal updated as of 11:30 AM PST.

We had no new alerts on the board this morning as the top 3 ranked ETFs play a little daily shell game rearranging their positions. 

Note that bond SHY has replaced bond IEF in the mix.  A closer study of the interaction in the various bond ETFs indicated SHY works better with AGG and TLT than IEF, hence the replacement.

GLD continues an impressive run as #1 ranked while the laggers are clearly TLT and XLU.
TLT is showing some MRSI and DB momentum in real time but entry signals have not fired yet.

Tuesday, September 18, 2012

TAQK and LM Updates...9.18.12

First.... a notification going forward.... I will email subscribers a rebalance alert for TAQK and  LM on the day of the rebalance.  And, based on the questionable advantage that was anticipated but not experienced as a result of rescheduling the rebalance until mid month, we will revert to the original end of month rebalancing.

The currently planned rebalance schedule is 9/28, 10/31, 11/30 and 12/28 through the end of the year.

Keep in mind that the goal of rebalancing is simple...to keep the capital allocations for each component ETF at the targeted percentage.  Depending on when accounts are set up and the size of those accounts, the entry allocation amounts can be widely different, so a simple template will be emailed out on the day of the rebalance for calculating the exact number of shares in each position to be adjusted.
This process may sound complicated, but it's not.
I'll post a sample rebalance template well before 9/28 just to make sure everyone understands.

There are no new ALERTS for the T3 Situations this morning.  I had expected DB or MRSI to signal a BUY on TLT but so far the signals have not triggered.

Here are the updated TAQK and LM models as of 7:30 AM this morning:


Monday, September 17, 2012

Rebalance % for TAQK and LM.. 9.17.12


Here are the TAQK and LM model rebalance percentages to be executed today to maintain the programmed allocations. 
Since the 9.15.12 target date fell on Saturday we move to the next open market day...today.
With the markets currently in a narrow range day this is an ideal time to implement the adjustments. 
The percentage numbers apply to the current $ allocations for each component.

If green, add to the position by the stated % amount in $ as close as possible at the current share price.
If pink, sell the position by the stated % amount in dollars as close as possible at the current share price.

T1, T2, T3 T4..a Quick Look...9.17.12


Since you asked... several readers wanted to know why T3 and not T1 or T2.
Here's a quick visual response to that very good question as we take a squint at how investing in the top 1, 2, 3 or 4 works out  over 2 years.  We can see T1 has some problems resulting from trying to chase the leader, but T2 definitely is attractive in terms of total returns although it does have periods when it also lags.
T4 looks very similar to T3..our default model, and it has been a screamer over the last month.

While we could spent considerable time debating the merits of each model, it is apparent that either T2,T3 or T4 have robust correlations, produce similar results and involve a similar level of risk...while T1 is best avoided as anything other than a short term trading vehicle and a momentum indicator.  This is good news in terms of planning capital allocations but it's still up to each investor to determine which model suits his needs best.


The hairy bottom pattern will be reviewed in next Monday's research posting.

Sunday, September 16, 2012

T 3 Ranks for Monday's Rotation

As of Friday's close the top 3 ranked slots remain nearly the same as last week (9/7), although  XLE is now #2 and QQQ is down to #5. The performance metrics for the T3 system therefore call for the closing of the QQQ positions and the opening of an XLE position...keeping the portfolio in equal dollar amounts for all 3. The actual time of the rebalance is at user discretion,  but I have found that 30 minutes after the open yields entry prices that typically avoid the synthetic volatility created by the rush of Monday's Open at Market orders.

Friday, September 14, 2012

T 3 Update.. 9.14.12


As suspected, the FED's announcement of a new QE3 buying program goosed the markets dramatically Thursday and the action on TLT was particularly wild. As of this morning (Friday) TLT is taking a huge hit (-2.5%), putting it $1 below my previously suggested reversal level of 119.5.  The technical outlook on TLT look ominous right now but that could change in an instant...as it did yesterday.

GLD continues to post new highs with increasing momentum as it still holds #1 ranking after 14 days.

T3's performance is holding up very well relative to the SPY on both the 5 day and 30 day returns.

The red alerts on Tuesday morning turned out to be a bit premature (there's an understatement), but that's the way the MRSI and DB signals called 'em.  Had the FED not announced QE3, yesterday would have turned out quite differently. Monday's upcoming look at the hairy bottom pattern may shed some more light on how the MRSI and DB signals assess momentum.

Recapping the 2 most recent short term MRSI/DB  colorized trades:
QQQ entry at 9/5 Open, exited at 9/13 Open = .98% return
XLE entry at 9/5 Open, exited at 9/13 Open = 4.4% return

Just as an aside look at how XLE migrated across the ranking matrix from slot #10 on 9/4 to its current #3 slot.  That's the pattern that makes money on the short term trades.
Now QQQ, that's another story, behaving more like a bug in a frying pan since 9/4 than a momentum following ETF, but it's still on a strong run...just not as strong as our other T3 components.

Based on the week's earlier issue with T3 ranking data being end of day and the MRSI and DB signals being real time...I've added an ALERT line above the rankings and in the future will post any new entry or exit signals on the day they fire on that line.  In the event that the T3 is not scheduled to be published that particular day when the signals fire I will issue a special T3 alert post prior to the close that day.

Thursday, September 13, 2012

LM Update...9.13.12

We are seeing a little pullback on the equity curve as forecast last week.  Note that the Mosaic flux is close to the zero line...the goal we were planning for when the rebalance date was changed from the 1st to the 15th of the month.  UNFORTUNATELY, the best laid plans of mice and men sometimes go astray (as the old saying goes) and here we are on Sept 13th about to hear the FED's plans for QE3...an announcement that will likely push volatility to the bands for the SPY and it will be interesting to see how the Mosaic flux performs.

TLT has picked a bit this morning having reached and bounced off the previous August lows.  TLT is technically poised to regain 127, a five point margin.  I'll be checking the MRSI/DB Ouija board for possible entry signals.

One of my thoughtful subscribers asked why the % returns are different for the Mosaic and the Mosaic RM model when a quick look at the short term comparison chart shows that RM has not gone to the safety of CASH since June (flat line area of price chart).

The difference derives from the fact that the equity in the Mosaic and RM models is not the same.  RM has been in a safety (CASH) mode several times during the 4 year lookback period, which has resulted in both a lower drawdown and a lower total equity return. While the NAV of the model Mosaic is $ 181.41, the NAV of the RM model is about $20 less at $160.25.  A $3 daily change (for example) in the Mosaic portfolio value = 1.66% while that same $3 change in the RM model = 1.88%, and as a result the performance results will track somewhat differently.

One of the features of market neutral investing is that charts are not used to forecast price behavior.  While we do use charts to report previous model results they are not used to construct the model or forecast model equity curves.
Based on reader requests and in a departure from that theme Monday's research will focus on one of my favorite chart patterns - the hairy bottom - a term I coined almost 10 years ago to describe a recurring and highly reliable indication of impending momentum change. The pattern can be seen on 2 minute bars and daily and weekly bars as well and can be effectively applied by both traders and investors.

Wednesday, September 12, 2012

T 3 ALERT...9.12.12

This is an ALERT post.
Note that XLE and QQQ have new EXIT signals as of one hour in today.  I have also posted the GLD Short signal although we typically don't post or track short signals and I am not going to continue to track the action on this signal other than to note that it fired.

The point is that we have several new signals this morning indicating a possible period of equity retracement.

Just to avoid confusion.....the T3 format runs in EXCEL and updates at the end of day.  The MRSI and DB color signals run on TradeStation in real time and are imported into the T3 EXCEL platform. 
The momentum rankings shown today reflect yesterday's closing values.
The color signals reflect the TradeStation signals for MRSI and DB as of 7:30 am PST.

Of course everything could change tomorrow if the FED launches a QE3 program, which has been highly anticipated by the markets in the recent low volume build up.  A new QE3 initiative would like send the markets soaring once again but since we're already at multi year highs it's hard to determine how far such a run could extend unless we start using Fibonacci lines or some other such technical forecaster.  If the FEd disappoints then look out below for equities.

Since our goal is to minimize T3 capital exposure during periods of high volatility the safest course of action is simply to close any Longs and stand aside for the moment.

Interestingly, either scenario is likely to reverse the recent weakness in bonds, especially TLT.

Tuesday, September 11, 2012

TAQK....9.11.12

Here's the TAQK model update and this approach is obviously lagging a bit on the short term...5 and 30 day returns.  As of yesterday's close SPY has taken over #1 momentum ranking although this morning's stats suggest there may be a change in tonight's risk profile based on the MRSI and Delta Band studies.

If there are changes in the model T3 MRSI and DB color signals as of today's close they will be posted by 4pm this afternoon PST.

In future posts the focus will shift to the Lazy Man model and its variations.  There's a number of short term and long term opportunities with that model using the Situations momentum rankings and the MRSI / DB signals and we've really just begun to explore them.

Next month we'll also begin a look at an adaptive version of the model....one that adjusts the position sizes on a weekly or monthly basis, dependent on relative momentum and relative strength in each of the portfolio components.

Monday, September 10, 2012

Bonds are Different..9.10.12

One of the fundamental concepts in a market neutral approach is the necessity to build a portfolio of non correlated or inversely correlated assets..  To accomplish that end virtually all our models use bond ETFs of some sort to provide the other side of the equities coin.  What may be surprising is that all bonds do not behave in sync and, in fact, its not uncommon to have the various bond ETFs act contrary to one another at times.


This is a quick look at 4 bond ETFs on weekly bars so we get about a 2 year lookback. The charts are shown on a Worden Bros. platform and the technical indicator in the lower panel of each chart is TSV, time segmented volume, an indicator that examines both volume and momentum at the same time.
TLT is the 20 year treasuries... the largest and most liquid bond ETF with robust options
SHY is the 1-3 year treasuries,,,typically half TLT volume and virtually no options
LQD is a basket of investment grade corporate bonds...low volume, few options
TIP is a basket of treasury notes with various expirations and rates...low volume few options

Each ETF seeks to embody the relative safety and returns of various sectors of the bond market.
Our goal is to create a blend of these various bond nuances and at the same time examine which bond ETFs are outperforming the others to take advantage of short term opportunities.It is for this reason that the T3 model includes 3 bond ETFs >>>IEF, AGG and TLT.

The matter then becomes one of juggling long term versus short term appreciation opportunities.  One result of this study is that LQD turns out to be a better short term performer than IEF and further testing is now  underway to determine if LQD should replace IEF in the T3 portfolio.We'll know by Friday. 

Sunday, September 9, 2012

T 3 And Lazy Man Updates... 9.9.12

Note a couple changes to T3:  The RSQ (linearity) metric has been added to further define the reliability of the model.  The higher the linearity value, the more consistent the equity curve.  The Momentum rankings have been reduced from 18 to 15 days or 3 weeks.  I think this provides a more than adequate view of the momentum dynamics and let's us integrate weekly bar models more effectively (jn the future).

Note that the Momentum rankings should now be adjusted on Monday's Open rather than Friday's close.
This decision is based on a recent look at how the markets have performed between Friday's Open and Monday's Close and it reflects a small edge that can be achieved by trading Monday's Open...which actually has been consistently lower than Friday's close during our lookback period. 

TIP has been replaced by IEF in the T 3 component mix.  WHY?.  Because now all the Lazy Man components are reflected to the T3 mix and there's no need to replicate (and confuse) readers with multiple views of the same data. That applies to the Situations version of the Lazy Man where all 6 components are held in equal dollar amounts and it also applies to the allocation version of Mosaic (shown below) that holds varying % of the capital account in each of the 6 components.


Friday, September 7, 2012

T 3 Update ..9.7.12

Our Situations matrix is chugging along, not quite keeping pace with the SPY,, but this is a risk managed approach, not a capital gains maximizing approach.  The T3 model is still well on track and GLD (gold) continues to dominate the #1 slot.  These are the results end of day (EOD) Thursday and as of 2 hours in on Friday GLD is up another 2% while the SPY is up .26%, which should improve the model results by the close.

Since several readers have asked... the results of the previous 3 closed trades on the momentum matrix are as follows with the entry (green, blue or yellow) being on the Open of the day following the signal posting and the close of the position (red) being on the open on the day following the signal posting:

QQQ: 3.0%;  XLE: .8%; TLT 2.6% .  Not outstanding resulting but each position made a gain (not reflected in the posted returns %) and gives us confidence that the ranking approach can deliver some supplemental returns.

QQQ has been a real squirrel since the green signal on the 4th and really ripped the sheets on Thursday.  I'll post the T3 update over the weekend to see if any of the current 2 longs have changed status.

Next Monday we'll see how the various bond based ETFs perform relative to one another and how proper selection can make a substantial difference in long term returns.

Thursday, September 6, 2012

TAQK Update ... 9.6.12

This is the mid week update of the TAQK long term portfolio as of Thursday 2 hours in..  Current metrics are all green, indicating solid equity accumulation.  The Model is lagging slightly on 5 day returns but otherwise is outperforming the SPY.

Note that the pending rebalancing values, which were previously divergent by over 5% on several days, have now settled now considerably.

The big surprise is the Momentum ranking of TLT in the #1 slot as of Wednesday night. This is an end of day (EOD) ranking and TLT was in the same position on Friday also.
A closer look at the actual ranking calculations shows that the variance between the ranked components is actually very slight (see below) but the ranking results are still odd at first glance.  We may get a change at today's close based on the equity surge today.


 SPY   QQQ   TLT   AGG   SH   XLK


3.00 3.02   3.03  3.01  3.00  3.01      

Wednesday, September 5, 2012

T 3 Update..9.5.12

Here's our current Situations as of Tuesday's close.  Note that I've posted the color signals for QQQ and XLE although I'm waiting for another day's confirmation before getting committed.  Why is that?
Because QQQ has fallen off the top 3 list where's it's held a long term position so this is an important development and we want to see if its just  temporary weakness or a change of trend.
Same story with XLE which has fallen off its hot streak to slot # 10 for the past 3 days.  Maybe it's time for it to get rolling again, but let's wait for a little for supportive evidence before jumping on this one.

Note to subscribers:
My attempts to explore variations of the Lazy Man portfolio and at the same time simplify the Newsletter format posted yesterday apparently caused as much confusion as clarity so let me try again to explain my intentions and my goals in moving forward with Lazy Man.

The bigger goal here was to provide 2 investment solutions using a similar portfolio.

#1.  A long term asset allocation model (Tuesday's LM model)  which currently holds zero position in SPY, although SPY may become an active component at some point in the future. 
    This is a risk maximized investment model that follows the requirement for monthly rebalancing and which includes a risk managed version.
    The model is like TAQK but obviously includes Gold and IEF instead of SH and XLK.
    This is essentially a buy and hold portfolio which may be added to incrementally as ACCUMULATE signals trigger, on a monthly laddering basis, or as the mood strikes you.

#2.  A Situations version of the  Lazy Man...posted Saturday..which is a fixed portfolio of the 6 ETFs in equal $ amounts.
    The goal here is to provide some shorter term trading opportunities using the Lazy Man portfolio while at the same time relying on the relative safety of this blend of ETFs..
    The Situations version will focus more on MRSI, Delta Band and ranked momentum based trading signals rather than the long term risk management behavior of the #1 version.
   
Based on the little survey a couple weeks ago most readers would like to trade either the portfolio ETFs or their options on a shorter term basis (5-10 days) to augment the equity appreciation of the Mosaic models and this is my attempt to satisfy that desire. From now on the Lazy Man will be posted in 2 versions:  (1) the long term proportional positions model and (2) the Situations daily format momentum version.
The Saturday Lazy Man post (in weekly bars) will be archived as a reference point only.  It was intended to showcase the tendency for various sectors to remain market leaders for extended periods of time and also to provide a basis for further research on how to capitalize on these trends. The effect is much more dramatic on weekly rather than daily bars and that was one of my goals for the post.

Future explorations into alternate Lazy Man (and other portfolio) formats will be reserved for Mondays. 

Tuesday, September 4, 2012

Long Term Mosaic Lazy Man...9.4.12

This is The long term Mosaic version of the Lazy Man (LM) with allocation adjustments.  Note that SPY has no position at this time.  The model has been on a hot run recently and is probably a bit overextended.  Nevertheless, all the performance metrics are green and its beat the SPY in evry time frame profiled. 

Note that the Allocation Adjustment date has changed to 9.15.12 as a result of a few hours of research this weekend.  See below:  Volatility historically increases around the end of the month..a situation we would like to avoid since it can actually make a difference in the portfolio adjustment trades, depending on the exact time they're executed.  Since our goal is to avoid risk and uncertainty, the path of least resistance is to simply rebalance the portfolio when volatility is relatively low...which turns out to be around the middle of the month.
As a result, the rebalance algorithm has been reset and will trigger on or about the 15th...at which time the precise adjustments will be posted for the TAQK and LM models.
The platform format was cleaned up over the weekend and the new schedule of postings is noted under "Commentary and Updates".  I've endeavored to explore some of the nuances of model construction and performance over the past month and that effort has apparently confused some readers so we'll get back to basics and focus on the mechanics of our market neutral approach.
Going forward I'll devote Mondays to posting ongoing research and related studies and then devote the rest of the week to focusing on the long term Mosaic models and the multi term Situations models.

Saturday, September 1, 2012

Lazy Man.. 9.1.12

As promised earlier in the week, this is the Lazy Man Portfolio...a project regular readers know has been a work in progress for almost 2 years.  This is a 7 year study and it doesn't get much lazier than this.

The portfolio just holds all 6 positions in equal dollar amounts and rebalances weekly, although rebalancing monthly produces similar results.

For those who want to use the Situations indicators for short term trades the momentum rankings of the components is included based on weekly bars, further reflecting the easy going pace of the model.

Next week we'll look at how to improve Lazy Man returns by just investing in the top 2 rankings..a selective process that increases net returns by 15% over the 7 year study period..