Monday, October 31, 2016

PONZO Update Surprise and Critical Reading...10.31.16

This week's Ponzo Updates have SPY in a surprisingly bullish outlook....same with TLT, although to a more modest degree.  The VIX forecast still has that gut churning out of the ballpark outlier scenario although short term the picture is more subdued.
The election dramatics have reached fever pitch and Zero Hedge has some blockbuster revelations you won't ever hear about on the mainstream media.Who'd guess that the guy in charge of the DOJ investigation of Huma's email is in fact Podesta's closest buddy and heavily linked with the Clintons.
Back to the world of serious trading...here are two links from FIN on a fascinating Reuters survey re the outlook for long bonds (in's  sync with the Ponzo forecast) and from Mauldin some deep thinking on the whole earnings shell game.


Saturday, October 29, 2016

VDX Updates and Trader's Outlook...10.29.16

This week's VDX updates display the extreme oversold status of both SPY and TLT...the later of which has now broken support and COULD BE open to a mean reversion reversal. The magnitude of bearish bars however suggests that there may be more selling in store and the slope of the yield curve DOES NOT support the mean reversion case at this time.
The markets remain in a nervous flux as daily wikileaks updates reveal the depth of the Clinton's pay for play schemes.  Expect increasing volatility up through Nov 5th as things are likely to only heat up as that pivotal date approaches.
We'll look at a couple potential credit spreads later in the week (condors actually) to try and pick off some scraps from the options desk on post election day.
In the meantime Trader's Outlook has some comprehensive volatility studies as well as an economic reports calendar that's worth a look.  The near term view is volatile and bearish.

 .


Wednesday, October 26, 2016

A Couple Pairs Teasers....10.26.16

Following yesterday's pairs post here are 2 more setups that have proven highly reliable over the past 2 years.  The metrics shown shown reflect only the last 6 months since, as we have painfully witnessed, paradigms change and standard deviation values then have to be adjusted accordingly.
For now both setups are slowly churning up the equity curve with modest drawdowns.
Setups shown have no money management stops in place, only a 10 day time stop.
(XLF= SPDR Financials sector ETF, TLT= IShares 20 year Treasuries ETF, SPLV=Powershares low volatility S&P ETF, SH=ProShares S&P500 Short ETF)
(click once on each chart to enlarge)


Tuesday, October 25, 2016

Profiting From The Rigged Oil Numbers....10.25.16

Most traders of my acquaintance appreciate that the periodic crude inventory numbers are highly manipulated and likely have little correlation with reality. Zero Hedge (my favorite link) has a timely piece on the issue and the key word here is "unexpected".  By whom is the question. Not by OPEC and not by Goldman.  It's funny how these announcements find oversupply one week and next week there's suddenly no inventory.  Maybe wikileaks can hack the Saudi oil ministers emails so we can get some clarity on the matter but until that time here are a couple pairs setup with XLE (this is the diversified SPDR oil sector ETF, NOT crude) paired against XLB (SPDR basic materials ETF) and UNG (natural gas ETF).  These are 6 months studies with a 10 day time stop on all positions.
The risk profiles here are quite attractive as can be seen by the actual chronology of trades.
When the trade triggers line up between the pairs the odds are seldom wrong.
This pair studies are part of a short term credit spread service for SPY, QQQ, XLE and XLF that we may begin next year...just testing the waters for now.
The charts have a lot of info but a single click on them will enlarge considerably.


Monday, October 24, 2016

PONZO Updates and Goldman Forecast...10.24.16

After a strong opening this morning we saw gold, silver, oil and bonds sink for most of the day with a modest recovery in oil by day's end.
The new Ponzo updates have a wild outlook for SPY. with.more volatile outliers than we have seen for months.
And the VIX outlook is just as scary if that 45 number ever gets hit.
Bonds, meanwhile look to be making a bottoming pattern and if equities go south into the Fall that's where to put some cash.
Goldman came out with their longer range forecast for SPY and the component sectors.  Their outlook is tepid to say the least although certain sectors may hold promise with patience.


Saturday, October 22, 2016

VDX Updates and Trader's Outlook...10.22.16

This week's updates have both SPY and TLT oversold while VIX dithers around a tight range (also oversold...marginally)..  The VDI + and- lines are downslope in all three charts...a very odd situation.
Earnings this season have generally proved to be positive with positive guidance.  Yeah, there are a few glaring disappointments like IBM and GE but the markets appear to be taking those "bad' reports in stride and we're not seeing sustained selling after the news.
This week's Trader's Outlook is modesty bearish...same as last week .
And, here's a little piece from ZERO Hedge noting the recent equity withdrawal trend.


Thursday, October 20, 2016

A Clear Bonds Paradigm...10.20.16

We mentioned frustration in attempting to identify the current dominant paradigm in both our market model and the Schwab no fee portfolio.  That's not a problem with bonds, as reflected in the M6 study of our defaut bond ETF portfolio comparing momentum and mean reversion modes. Where mean reversion is really revealed as the long term best paradigm is in the 2 year equity curve chart which has a linearity far superior to that of the momentum mode (almost 20%) .
Many posts have been devoted to emphasizing the preference for a mean reversion strategy when analyzing TLT and these performance matrices reinforce that argument across the entire bond sector.


Wednesday, October 19, 2016

Schwab M6 Update...10.19.16

I've been working with the local Schwab users group for a while now with a focus on using the M6 platform and 6 of the Schwab no fee ETFs.
The portfolio does a pretty good job of maintaining a full beta spectrum and below are posted the current signals for both the momentum and mean reversion modes with limit stops in place.
While the momentum mode produces superior longer term results its interesting that the short term equity charts of both models are almost identical...reflecting the lack of technical alignment (paradigm) within current market price dynamics
.

Tuesday, October 18, 2016

M6 Market Outlooks...10.18.16

Reviewing the current M6 momentum versus mean reversion modes leaves us in the same position as last week...virtually no edge in following  a single mode.  As with last week, the mean reversion model does display a better short term equity curve.
Running both modes creates a risk profile that looks a lot like a divergent pairs trading setup and surprise, both models made money today as both TLT and XLU were green..
We'll continue to post these profiles on a weekly basis as I move towards a more structured graphical format for Newsletter posts in 2017.
Intel and IBM disappointed after hours so expect weakness in the Qs tomorrow.


Monday, October 17, 2016

Ponzo Updates...10.17.16

Perhaps no surprise but both the SPY and VIX forecasts now have elevated volatility scenarios ....especially so in the case of SPY.   Keep in mind these are 25 year lookback charts so nervousness
about the election outcome and the looming December FED rate hike have a modest historical correlation.
What is remarkable (to me) is that both SPY and VIX have high volatility outlier scenarios tracking 3-4 weeks out....election time.
Needless to say the markets are feeling the burn and are likely to continue in a weak to neutral mode until a day or 2 prior to Nov.5....when fortunes will be made or lost.
Remember Brexit volatility?  Nov 5th could be a repeat.  A little early to look at straddles but as we get closer to E Day we'll look at a couple possibilities as well as DN setups.


Saturday, October 15, 2016

VDX Updates and Trader's Outlook...10.15.16

This week's VDX updates as of Friday's close have both SPY and TLT oversold and VIX trending into a less volatile mode.  Note that SPY and VIX have the VDI+/- lines converging (typically bullish), which TLT has the 2 lines diverting.
Earnings surprises, Clinton/Trump dynamics and now an increasing giddiness over the FED's possible timing may derail that sliding VIX ...odds are that it will.
The weakness in TLT that was forecast by Monday's Ponzo chart is coming true with a vengeance.
Historically the TLT slide should be bullish for SPY but the unknowns mentioned above have trader's on a cautious course for now.
The sell the open mode of last week carried through into Friday and the 
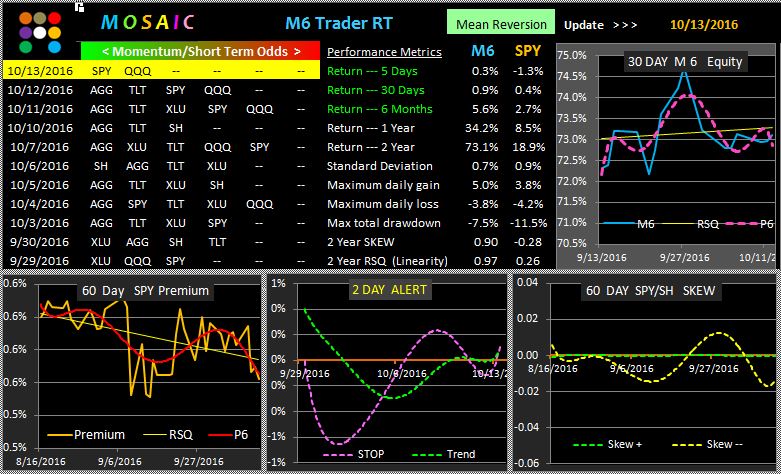
Trader's Outlook technical view is now modesty bearish.
This week also saw 2 reversal days on the delta neutral platform, some of which could have been minimized with the recommended trailing stop and this facet improvement of the platform remains a work in progress. I'd like to incorporate pivot levels into the trailing stops but, as usual, there are a few more wrinkles than initially expected that must be ironed out to generate a reliable stop setting.


Thursday, October 13, 2016

M6 Momentum vs. Mean Reversion...10.13.16

Today we look at the status of M6's short term forecasts and we find, as in a previous study, that there's no appreciable edge by pursuing either a momentum or mean reversion tactical approach.
The trick of course is in maintaining a diversified long/short beta portfolio.  One striking difference between the models is the longer term trend of the #1 ranked positions (eg,  AGG) in the me4an reversion model versus the more volatile status of #1 ranked positions in the momentum model.
My own personal preference is for the mean reversion mode since it tends to produce the most reliable signals even at the expense of lower total returns.  Just my opinion...not investment advice.


Wednesday, October 12, 2016

Just Treading Water...10.12.16

It looked like the market was going to get some traction today but the afternoon session erased most of the morning's gains and as we head into the close of the week the odds for the bulls are hard to find.  Early disappointing earnings may have spooked traders amid renewed fears of inflation, recession,  wikileaks exposure of Democratic dirty tricks, rampaging elephants, cholera, etc....
Nothing is certain right now and market volatility is more likely to increase than level out as forecast by the latest VIX Ponzo Update,
The current SPY profile using the VPM volatility filtered chartpack illustrates this argument.
While the VPM does a good job of avoiding drawdown the equity curve is clearly struggling and reflects the tentative reliability of technical analysis for short term forecasting.
When in doubt..stay out....which is what the 2 Day Alert is telling us to do.

Tuesday, October 11, 2016

Alcoa Poops Out...10.11.16

Glad I added that little caveat yesterday about earnings surprises...as Alcoa's grim numbers drops it almost 12% and the market followed suit with Illumina's bad report. The selling was probably overdone with SPY down to S6 but logic is not a tradable strategy as we have seen too many times.
A little update to the DN platform was sent to current users today that will help in the creation of true equal dollar value positions. Let me know if you didn't receive the update.
The benign VIX forecast has been totally wiped off the map as the VIX jumped 20% to 16+ so we'll hold off posting a sample narrow range butterfly setup....for now.
And then there's the TLT which we mentioned yesterday has a bearish skew.  This is what we saw today although bonds recovered substantially by the close. Still...the trend is down.

From the Schwab Options Trading Desk>>>

Monday, October 10, 2016

PONZO Updates Look Bad for Bonds...10.10.16

This week's Ponzo Updates have the VIX dead flat going forward and declining prospects for bonds.
The happy outlook for SPY that we witnessed last week has now become much more iffy with a variety of volatile outliers.
Things could change in a hurry however as earnings season kicks off with high expectations for rosy guidance in Q4.  If we see some major stumbles then all bets are off.
The most surprising chart is probably the VIX and for risk tolerant traders this is the perfect forecast for put butterflies...a sample of which will be posted tomorrow.


Saturday, October 8, 2016

VDX Updates , Pound FlashCrash and Trader's Outlook...10.08.16

SPY and TLT are now OVERSOLD on the VDX charts while VIX remains in a neutral stance.
Of concern is the fact that the SPY VDI+/- are diverging, not converging, suggesting good odds for more downside...perhaps back down to recent support levels.
As a side note the recent flashcrash on the British pound should serve as a warning for momentum traders...mean reversion is NOT the current paradigm for global currencies. That's why I like DN.
Meanwhile the Trader's Outlook is modestly bullish but with many caveats attached as earnings season kicks off and expectations for about average returns become the norm.
Kudos to Randy at Schwab>  Last week's Trader's Oulook bearish forecast played out with uncanny precision even in the face of the "buy the opening dip" pattern for much of the week.


Thursday, October 6, 2016

October Metrics and TLT Worries...10..06.16

Here's 2 views of the current market environment courtesy of my friends at State Street Advisors.
We are seeing a lot of sector churn and these momentum based  metrics may rotate quickly.  For now sentiment is NOT bullish and the movement of capital is going towards financials.
Following the State Street charts is the current TLT outlook using the VPR model with the volatility filter turned ON. We're not making much headway with TLT  these days after a strong 6 month showing using the standard mean reversion model....leaving us to once again ponder exactly which paradigm will emerge as the most tradeable for the coming months.


Wednesday, October 5, 2016

M6 Momentum vs Mean Reversion...10.05.16

Here's the current M6 default market model looking at a balanced beta spectrum with appropriate stops applied.  Its been difficult lately for traders to get traction in recent markets and equally as difficult to decipher whether market dynamics favor a momentum or mean reversion paradigm.
The long time end of month and seasonality odds skews published by the Trader's Almanac have proven woefully unreliable and otherwise reliable metrics like put/call ratios and RSI2 have only been consistent in their generation of false signals.
What's interesting about the M6 results below is that regardless of the paradigm the short term results, the 30 equity curves and the 2 year RSQs look almost identical.
AND both are at the zero line on the 2 Day Alert
While we wait for a volume breakout the delta neutral approach continues to be our safety net.


Tuesday, October 4, 2016

Ponzo Updates...10.04.16

This week's Ponzo updates look pretty much the same as last week.  If anything, TLT looks more prone to weakness, the flip side of which is the implication that SPY will be bullish going into November. The VIX forecast remains a narrow range consolidation pattern but earnings surprises and/or some new political revelations pre-election could trigger a surge back to the 20s.


Saturday, October 1, 2016

VDX Updates and Trader's Outlook...10.01.16

The markets continue to muddle around neutral pivots as we slide into historical bullish seasonality.
On the flipside, the Trader's Outlook is moderately bearish.
The whole historical odds perspective provided by the Trader's Almanac has proven to be highly unreliable from past May until the present.  Clearly the markets are responding to a new set of catalysts and worries to create such a serious disconnect with past seasonal timing correlations.
We've harped continually on the need to be in the correct paradigm phase...either momentum, consolidating or mean reversion ....and later next week we'll post some recent LQB research on that theme.
Note that both SPY and TLT have VDI+/- lines at a crossover while VIX is double down.  This may explain in part the current trend of rising call prices and falling put prices.