Thursday, January 31, 2013

T6 LAB Updates...1.31.13

Here are 2 T6 Lab studies.
The first almost perfectly replicates the AB model by using XLK as an added component to the mix.
The advantage of using the T6 approach is that we can trade the top 1 or 2 momentum components while still deploying capital to the top 6 model for longer term returns.  This approach also gives users a choice as to whether just pursue a top 1 or 2 tactic or divide capital into a number of pools.
This is my alternate AB model portfolio which include IWM and XLV which I have discussed previously as 2 issues likely to benefit from Obama's re-election.    This model has a lot potential going forward, especially when actively traded...that is, on a weekly basis.
IWM and XLV have been clear leaders over the past month and the metrics panel shows it. On a 2 year lookback basis its no slacker either and this formulation is the most attractive mix so far as an AB portfolio.

Wednesday, January 30, 2013

LM, TAQK and AB Updates..1.30.13

Here are the current tactical allocation model metrics. As indicated previously the TAQK model will be retired this month and replaced with the AB model.  Based on the lagging returns of TAQK versus our other more diversified models this looks like a timely decision. 
Going forward I intend to focus more on models built and tested in the T2 and T6 labs so that readers can use the software to refine models of their own design and more closely track the performance metrics of the sample portfolios.
Note that LM and TAQK are back in cash as of yesterday's close. 
The rebalance date is also tomorrow 1.31.13 and the rebalance calculator sent to each reader can be used to calculate the new share allocations per the posted models.

Tuesday, January 29, 2013

STX / WDC Pair....1.28.13

The way this idea got started was I went to a seminar run by a couple Oppenheimer whiz kids who manage about a gazillion dollars using O'Neil's Canslim approach (Investors' Business Daily).  The focus of discussion truned to Seagate (STX) and Western Digital (WDC), who between them control over 85% of the disk drive business. Toshiba has a minor role in the business but these 2 have a virtually lock on the industry.  Whether they collude on pricing within this almost monopolistic milieu is subject to speculation but they seldom get far afield from one another.  I decided to take a look using the MO2 pairs analysis.
As usual, this is a 6 month performance report and, as expected, the correlation is very high..92%.  What's interesting to me is that there are windows of opportunity within this pair (4 trades in 6 months that have produced respectable returns with little risk exposure.  The center chart (yellow line) tracking the rolling log ratio of these 2 stocks shows clear support and resistance levels.  They don't get hit very often...30 days is the expected duration of the trade...but when they fire the results are very predictable.  Although it would be nice to see more data points along the equity curve the last thing we want to do is try and force trades out of this pair...we just need to take what it gives us and then move on.
This is an unusual pair, to be sure, but it provides a sweet niche trade most traders never discover.
I'll continue to track this pair as part of the ongoing work in progress on the pair trading portfolio.

Monday, January 28, 2013

T2 Update 1.27.13

This is our default T2 model, which is holding it own against the SPY.
Since everyone has the T2 software you can monitor this model on a daily basis without my assistance.
Current momentum is clearly positive...we have been above the short term RSQ line for almost 2 weeks.
The significant change in the rankings was IWM, which has now moved in #3 after a very extended run as either #1 or #2.

Last weeks' recommendation, based on the VTV signal, to close the XIV position turned out to be a timely decision.  Although the markets are considerably overbought past historical evidence suggests they could get stretched even further.  The question you've got to ask yourself is (not "do I feel lucky") any further rewards are worth the risk.  Apple has demonstrated what can happen when poor earnings and poor guidance coincide...the results can be dramatic.  Luckily, with the T2 approach we are buffered against such volatility but careful monitoring of market momentum is still valuable in preserving our hard won gains.

Tomorrow we'll look at an interesting pair set up that is very low risk and which merges technicals and fundamentals.

I'll be on the road for a couple days and Wednesday's post will probably be quite late due to lack of web access.

Friday, January 25, 2013

New T6 Test LAB,, 1.25.13

Here's a first look at the new T6 Test Lab...developed as part of my explorations for a new AB tactical allocation model.  This lab has it all...the ability to test proportional positions and a momentum algortithm.
The 2 year and shorter term (3 month) metrics have been realigned and new interactive charts have been added to assist in diagnosing potential risk exposure.

The goals for using this test lab are:
1.  Trade the top 1 or 2 with the best short term (3 month) metrics.
2.  Maintain a core portfolio of bond and equity ETFs to select a variable 6 components model.

If any of the 6 components develop a down slope RSQ they will be removed from the portfolio and replaced with another components that is up slope.
This rotation is accomplished once a week after Friday's close.
The periodic reshuffling of the model components will require a separate performance tracking program (yet to be developed) but the current format looks very encouraging.  What's not shown here is a top 6 metrics panel which, over 2 years, delivers results superior to SPY with considerably less volatility.

The T6 Lab offers a way to look at the markets adaptively based on 3 variables:
1. Proportions of capital deployment
2. Momentum of the components
3. Ability to replace under performing components with issues more in sync with current market trends
As you may suspect, the actual layout on the screen is these 2 panels side by side but, for the sake of clarity, I've broken the screen apart and posted in a vertical 2 screen format.

Thursday, January 24, 2013

VTV View Still Positive, BUT...1.24.13

Short Apple, Long Netflix...if you had that pair trade last night you are one happy trader this morning.  The talking heads are projecting AAPL at $ 425...a number Jeffrey Gundlach predicted a couple weeks ago.  We shall see.

Meanwhile, with the Dow up 96 points the VIX (which almost always reacts contrary to Dow momentum) is up 1.2 to 12.61...reflecting just how crushed the VIX has gotten over the past few sessions.

Here's the updated VTV view and yesterdays warning to take some profits now is even more urgent as the P3 and P6 on the VTV chart continue to diverge..

Tomorrow we'll run the tentative AB model through the T2 lab and look at several investment scenarios that may be implemented using your T2 tracking software without using a tactical allocation approach (variable % of capital deployed to each position).


Wednesday, January 23, 2013

LM, TAQK & AB Updates..1.23.13

It's an odd day at 1 hour int today.  Only 7 of the the Dow 30 are green, led by IBM..up almost 6%.
The rest of the markets look ready to pull back and technically the mean reversion spread is definitely stretched to normal reversal thresholds.
The VIX at 12.36 is REALLY LOW and, as mentioned before, has frustrated the 14/20 VIX band traders.
Best to hold back on volatility trades for now although the VTV model has done a great job of capturing the action...so far.
VTV users should note that the P3/P6 signal is divergent...a cause for extreme caution and one tactic to preserve gains at this point is to close 50% of the position to lock in gains.

Here are the LM, TAQK and AB updates.  AT the end of the month TAQK will no longer be tracked...just LM and AB....providing a more diverse view of  equity/bond portfolios. 

Tuesday, January 22, 2013

T2 Commodities...1.22.13

Here's a brand new model using commodity ETFs and a couple old favorites..AGG ( aggregate bonds) and XLU (Spyder Sector Utilities)...a favorite risk hedge.
We try to cover the commodity spectrum as much as possible while avoiding the low volume ETFs that have wide spreads and a narrow focus.

Here are the composite charts of our target group and you'll notice right away there's considerably more variation than in our T2 default model....hence, there should be more opportunity for using a T2 approach.
Running a simple top 2 model (below) with AGG as a benchmark delivers a nice total return but  the equity curve is clearly volatile and subject to short term drawdown whipsaws that can make the average trader/investor ponder the wisdom of following such a model.

This risk situation can be managed somewhat by rigorously following the caveat in the General notes for T2 (above) which advise following the equity curve position relative to the RSQ and P6 as a guide to take or ignore the current momentum signals and to use those same RSQ and P6 indicators as working stops for the portfolio.
I've highlighted the stopped notation in the notes to emphasis this point at the suggestion of one thoughtful reader who has been testing variations of some of the posted models.
Feedback is always welcome.
Our goal is to make the models as functional and as useful as possible in growing and preserving your capital.

Friday, January 18, 2013

2 Stock Portfolios for 2013...1.18.13

For those seeking to delve into stock models using the T2 approach here are 2 sample portfolios.
The first, SA, is based on the previously posted Seeking Alpha model and is based on their considerable research and experience.
The second, WS, is based on a Reuters article that popped up yesterday and identified Wall Street projections for the top earnings companies in 2013.  They had 10 recommendations so I've added SPY as a benchmark, but it still remains part of the portfolio.
You can play around with these as you wish with the T2 software.
Try a top 1 setting and the net returns pop...but at the expense of increased risk.  Hence..and I know everyone is tired of me saying this,,,but watching the short term action around the RSQ and P6 is critical to not letting your gains slip away.
With the T2 software you can just save each model portfolio as a separate file and load and close as you choose.
Note that GE and WMT appear on both lists and that the SA model involves a bit more diversity than WS.

Today's market has just turned red at 1 hour in.  The VIX is at 13....that's low....and regular VIX traders are probably savoring the mean reversion setup that says long the VIX at 14, short at 20.  That setup worked for quite a while, but it's currently in jeopardy.
It's monthly options expiration today so expect a few gyrations along the way although volume is currently lagging and Apple's again below $500.
Monday the markets are closed but Tuesday we'll look at a T2 model using just commodities.

Thursday, January 17, 2013

VTV Forecast + All Bonds T2..1.17.13

First, a correction.  Yesterday's link to the TIPS article was authored by Ron Brown of Eqis.  Today's link about the state of the economy does refers to recent statements by Jeffrey Gundlach of DoubleLine Capital.
Here's a look at what the classic setup in the VTV model is showing:
I've segmented the actual software display screen to show the results...otherwise they're impossible to read on this size screen. VTV is still bullish and short term the results match XIV.  This could chnage quickly so, as always, stops need to be followed.  The QQQ/SH trade (Long QQQ) has not been attractive for the entire course of the lookback period.  The Qs have clearly been lagging largely on the heels of AAPL weakness.  As earnings season continues we're likely to have either a trapdoor crash or a rise to new highs...and there's multiple arguments for each scenario .

On a different note....if equities do become unattractive here's an abbreviated all bond model in T2 that looks promising.  I could have added JNK (junk bonds) and a couple other ETFs but I'm trying to do double duty here and look to optimize candidates for the stlil pending AB model.  The results may be a bit surprising considering there are no equity ETFs in the mix.
The markets are closed Monday and Intel reports tonight so we may see some action Friday after a series of narrow range range.

Wednesday, January 16, 2013

LM, TAQK and AB Model Updates...1.16.13

This is the latest version of the tentative new AB model to replace TAQK.  We've eliminated TLT and I'm continuing to look for a substitute for TIP in an attempt to minimize exposure to Treasuries.  Here's a little aside article on the matter from Gundlach, who's in the same league with Bill Gross regarding bonds.The new AB more closely mirrors the cyclical flux in the SPY versus LM or TAQK, but both versions of AB have superior drawdown metrics relative to SPY.  This is not the final version of AB...I hope to have that nailed down by next week.
Based on yesterday's SPY/QQQ/IWM study we may also replace SPY with IWM in the AB model and allocate some capital to that position...thus creating a true 6 component portfolio.
And, here are the LM and TAQK updates:
 The removal of TLT from the new AB model contrasts with the LM and TAQK models most dramatically in 2011, when TLT was driven by QE1 and 2 and was making new highs each week.  Looking at the longer term chart of TLT we can see that pattern is not as consistent as some of the other non-Treasury driven bonds, hence the alternate portfolio to complement the LM Model...which will be retained.

Tuesday, January 15, 2013

T2 LAB..Benchmarks Do Matter...1.15.13

This is a little study using several portfolis comprised of the same 5 bond ETFs and one equity ETF...either SPY, QQQ or IWM.
The study focuses on the variable risk/reward generated by using each of the 3 equities as a benchmark and as part of the T2 (top 2) tactics.
I'm giving you some homework to do at the end of the post using the T2 software so you can test your own ideas and perhaps improve on my study results:
First...using SPY.......
Then QQQ....
And, finally IWM.....
A quick look at the 3 metric panels shows QQQ is a best bet when looking at a top 2 based mix of these ETFs over 2 years.  RSQ is clearly higher as are net returns. What's lagging are the short term (30 day) returns.  On that basis the IWM based model blows the doors off.
Based on those results..here's a look at the top 1 version of the IWM model:

This version using only the top 1 tactic shows several nice features.  Good long and short term returns and the momentum tactic cuts the IWM benchmark risk profile in half.  The RSQ is lower than the QQQ top2 version but there's no collapse off the RSQ like the Qs version displays.
You can check out other nuances of these 3 benchmarks yourself but this preliminary research indicates SPY is less attractive than either QQQ or IWM as a equity-side component in our models.

Monday, January 14, 2013

T2 LAB..Model AB tests...1.14.13

I'm continuing to focus on refining the new Model AB components for a 2013 defensive portfolio. 
The problem, of course, is that past results are absolutely no guarantee of future returns.
The best we can do then is build a historically correlated component mix and prepare to go to cash when the model dynamics reach certain thresholds of weakness...hence our RSQ and P6 indicators.
After running over 50 test portfolios this is about as good as it gets risk wise when holding a fixed portfolio of equal dollar allocations for a 6 component model.  A nice RSQ of .98 has kept the drawdown to a minimum although the equity line cross of the RSQ back in mid October would have argued for a CASH position.
If we use a top 2 approach with active weekly rotation our returns are cut almost in half, volatility is increased 300% and we incur more trading costs and maintenance effort.  This dismal situation may be traced to the failure of the momentum algorithm to provide an accurate forecast or other factors, including the whipsaws above and below the RSQ.  Whatever the causes, the fixed portfolio, in hindsight, looks like the path of least resistance...and risk.

Keeping with the mission statement of Mosaic, our next tasks include:
1. Refining the AB portfolio allocations using these components.
2. Using these and other components to build several shorter term trading models using the T2 and/or VTV momentum approach.

Friday, January 11, 2013

T2 LAB. Towards a Unified Approach..1.11.13

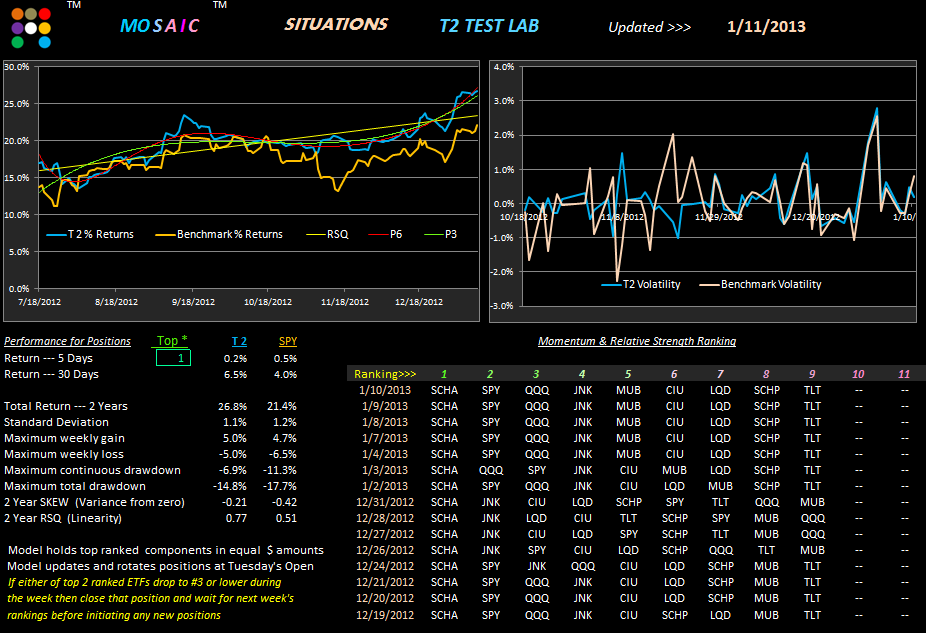
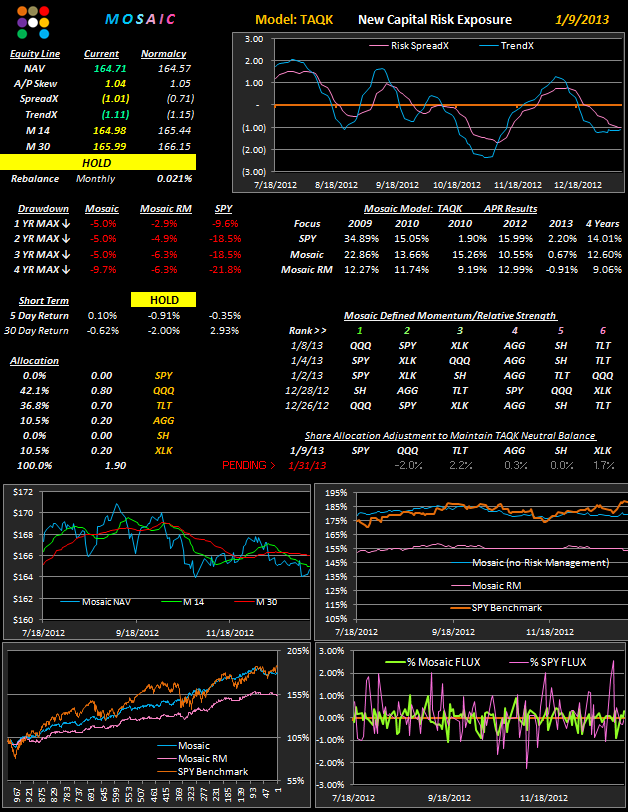
This is continuation of yesterday's test model...but we've added QQQ to the portfolio just to see how returns and volatility are affected.
Looking at a top 1 study the new 2 year returns with QQQ are upped by 4% and total max drawdown is also upped 2%. This pop in volatility can also be seen on the relative SKEW values for the 2 models. 
With this increase in volatility the logical question is."how to avoid it"?
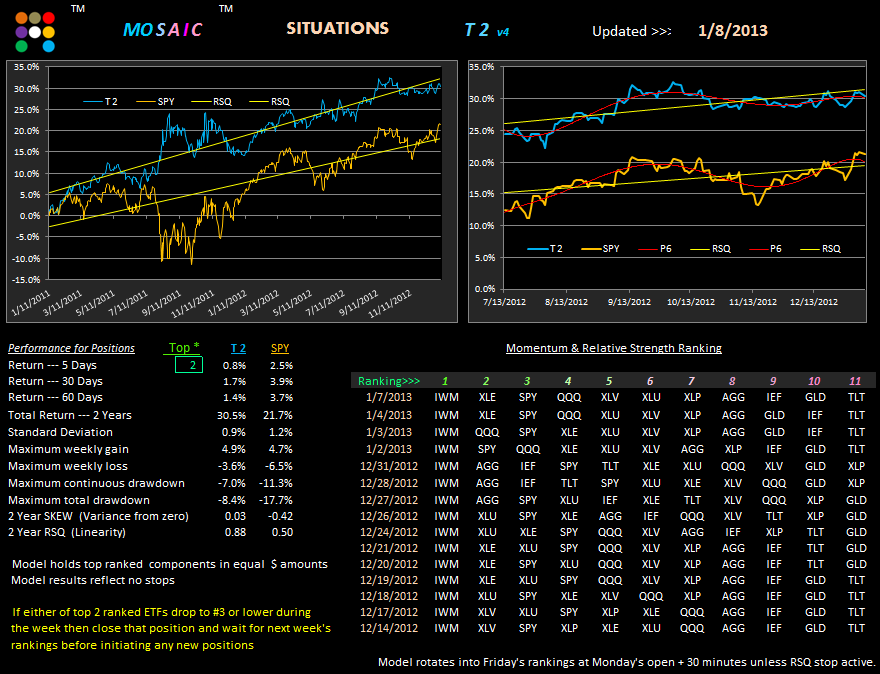
A look at the 2 year performance chart gives us a good starting point for controlling our risk exposure.
As usual....we're looking at the SPY action in orange and the top 1 model in cyan.  This is clearly a much more volatile chart that yesterdays top 8 composite chart and there's considerable more trading involved to generate the projected returns.  One way we can make the whole job easier is to follow our stops (old story, same story), including the RSQ and P6 (and the P3).

Our general trading guidelines and basic premises include:
Long crosses above the RSQ; CASH for crosses below the RSQ.
And/or...Downsloping P6 warrants CASH; upsloping P6 supports Long positions.

Sometimes the RSQ and P6 signals are not in sync and the P3 may provide some guidance in clarifying the likely longer term trend.  This guidance is muddied by the fact that we are always focused on following an upward sloping RSQ which, given the longer period of the P3, will always produce lagging returns.

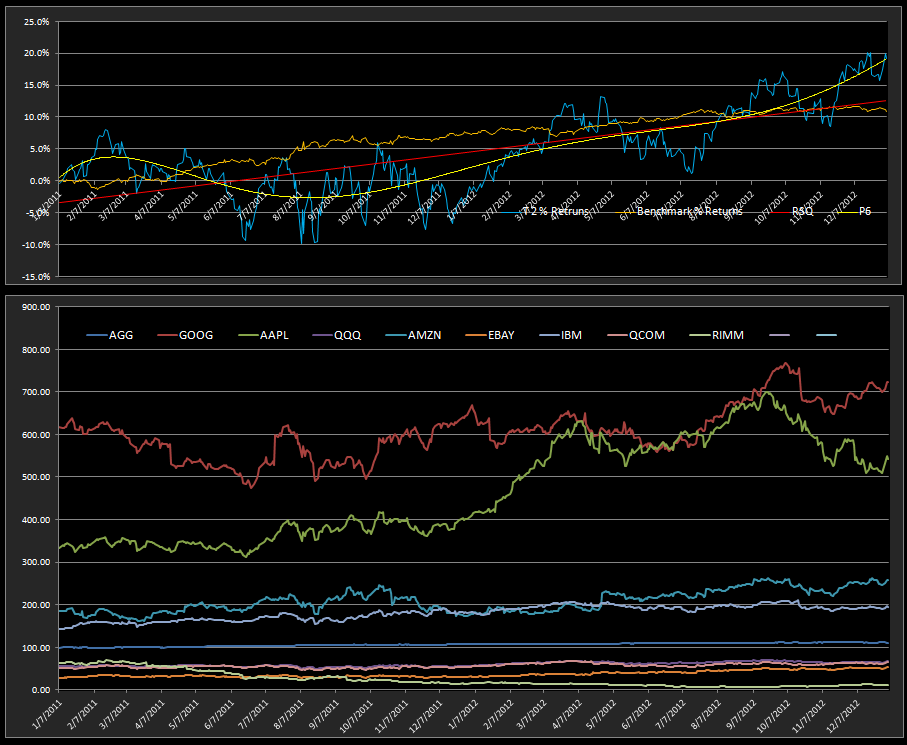
So let's use P3 and P6 together.   Looking at the 6 instances of  P3 and P6 crosses below we can visually see that following a tactic of using P3 as a stop for the P6 slope, either up or down, avoided  a major drawdown period while keeping the position in CASH during periods of consolidation.
The price to be paid for this safety net was the loss of equity during the 8/11 and 9/11 period. 
But there's a solution to that giveback also.
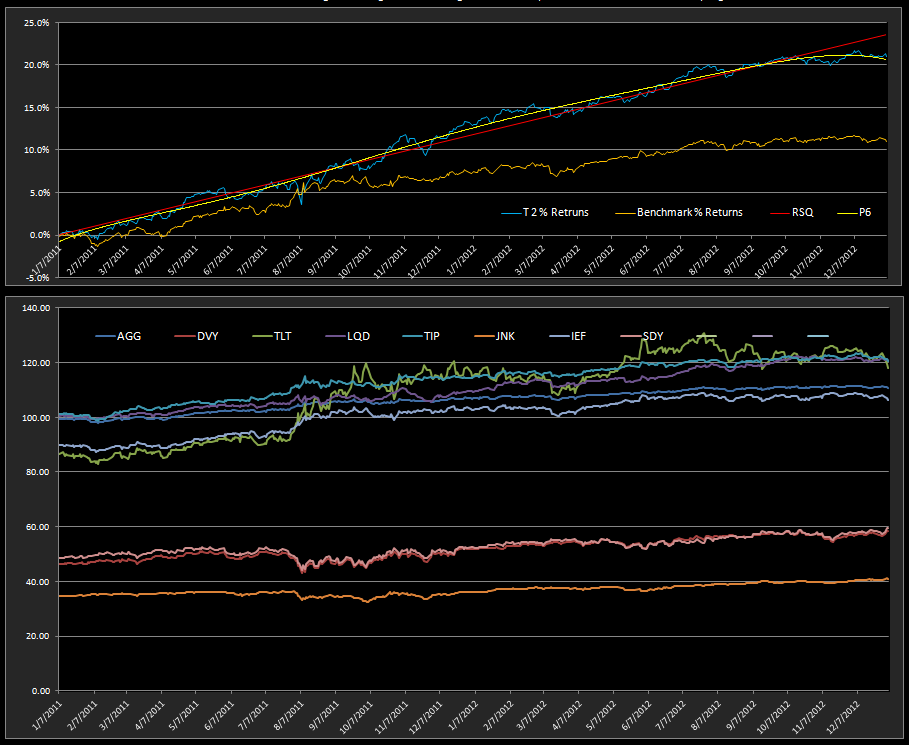
It's simply following the 6 month indicator chart on the main metrics panel of T2 (top of the page). 
This 6 month chart produces an entirely different scale of analysis than the 2 year lookback and let's us apply the same tactics in a much shorter time frame.
As you might expect, we'll look closer at this dual time frame approach in upcoming posts.

Thursday, January 10, 2013

T2 LAB..Balanced Portfolio...1.10.13

This is a series of tests I've been running while working towards a more unified investment program which includes both short and long term positions within the same portfolio.  Note that SPY is gone as well as QQQ.  I've added 2 Schwab commission free ETFs.. SCHA, SCHP to ease the transaction costs if you've got a Schwab account.  Also new is MUB, a muni bond fund mostly focused on California and CIU, a corporate bond fund focused on the financials.

We've only got 8 ETFs here but for our current purposes this represents a full house. In the first model we look at top 1 performance, which has been dominated recently by SCHA, the small caps.  What's to not here is the 5 and 30 day returns..while also noting the attractive 2 year returns relative to SPY.
In the second test we look at the results of running a top 8 model.  No rotation here just an occasional rebalance to keep capital deployed equally among the components. 
We're obviously not keeping pace with the 11 ETF default model but there's not much work involved here either. This is a bond-centric model with SPY and SCHA to provide juice on the equity side.  The danger here is that bonds implode, as mentioned yesterday, and then all bets are off and we need to seek a fallback.
Below we see the equity curve of the top 8 version..pretty darn straight...as reflected in the RSQ of 96.
You can run the model yourself and will see that the top 1 equity curve is considerably more volatile.
Tomorrow we'll look at ways to game to model and pick up incremental gains along the way....going back to the goal of a unified investment portfolio

Wednesday, January 9, 2013

LM & TAQK + New AB Model...1.9.13

The LM and TAQK models have been under performing total returns lately although the risk profiles remain stable.  Going forward into 2013 I'm planning to replace TAQK with a model like AB, which is a refined version of the TAQK concept. 
We work off the premise that technology is the engine that drives the economy but that there are always technical and fundamental hiccups along the way that create bumps in our expectations for linear price appreciation (like earnings).
At the same time the bond sector has been on an unrelenting rise for years, prompting more than a few "smartest guys in the room" to predict an impended collapse in bond prices.  If such a pattern reversal does occur it may not necessarily follow that equities will surge.  We may, in fact, enter a period where both bonds and equities decline...hence the safety net of the RM versions.
TLT's extraordinary rise in late 2011 to 2012 can be traced in a large part to the FED's QE bond buying program, which may be scaled back in conjunction with likely debt ceiling reformulations. 
When and if that happens a whole new set of bond dynamics are likely to develop with a more bullish focus on junk and corporation bonds and reduced returns from Treasuries. Municipal bonds should be a safe haven, but they have proven be to unreliable and volatile lately as more cities are going bankrupt or facing that prospect, losing their tax bases and grasping for new revenue sources.  The situation is not likely to improve short term despite the talking heads in the media forecasting a rosy economy ahead.
We're not out of the woods yet...
In trying to prepare for whatever bond/equity skew develops next the AB model looks like a better bet than TAQK as presently constituted.  AB is a tentative model which will be refined over the next week or so before a more definitive version replaces TAQK.  Until then here a first cut.  Note the risk drawdown profile...especially for the RM version.

And, here are the weekly updates of the LM and TAQK models:

Tuesday, January 8, 2013

T2 Update + T2 Banking...1.8.13

The markets are not happy this morning as the advance decline line (NYAD) is crumbling badly.
TLT is finally showing some bottoming action along with gold...both of which are up > .5%  as of 2 hours in. A lot of chatter on the low VIX...opening this morning less than 14 and now up over 3% for the day.

A look at the T2 default model still has IWM in the lead but that XLE second rank is a hold over from last week.  The T2  RSQ stop is still in place so all positions should be flat at this point.
A couple readers asked me to run a T2 model focus on the financial sector, which has been on a run up lately.  Here's one version for your consideration and the results are not all that encouraging for long term positions.  As with the tech and gaming models stops must be closely followed.
Note the volatility chart relative to SPY.  If nothing else the component overlay of the charts below should help rationalize the use of XLF as an appropriate proxy for this sector...it evens out the volatility of the "jumpy" price patterns that otherwise follow a very similar pattern.  This version shows the results of a top 6 study.  Things get even more volatile when smaller top numbers are explored.  Based on the above metrics (5 and 30 days) there are some trading advantages using the momentum model but caution is clearly required when the equity curve violates the RSQ and/or P6.

Monday, January 7, 2013

RM -Cash....T2 Lab Tests..Tech and Gaming...1.7.13

The RM versions of the Mosaic models have gone back to cash as of today's open.  We're seeing more whipsaw action in the RM models than in the previous 4 year lookback.  Clearly there's instability in the markets and the upcoming earnings season will likely only accentuate that volatility.

Today's studies explore 2 sectors that one would normally expect to show superior results relative to our wide sector default model.  First, the tech sector where we look at some of the high fliers along with QQQ. Just for risk exposure purposes analysis we'll use AGG as our baseline. 
What's interesting is that when we choose the top 2 or the top 9 the results are pretty much the same. Looking at the 2 year charts of the components below allows us to see the volatility profile a bit clearer.  It also makes clear the need for stops when looking at the RSQ and P6 curve.
 Then we look at the gaming sector (which also includes resorts and cruise lines (RCL and CCL).
Again we have used AGG for the baseline. And, in contrast to the all bond portfolio profiled last week the volatility on this portfolio is an attention getter.  You can play with top 1,2,3,4 etc models but it doesn't get better. The 2 year component charts are shown below displaying a bumpy ride along the RSQ equity line.
This is a clear case where the risk is not worth the reward.  As we saw last week...there's much easier ways to achieve a 10-11% APR with much, much less risk.

Friday, January 4, 2013

The FED, T2 and T2 Bond Lab..1.4.13

That comment yesterday by Bill Gross about the FED and Treasuries really spooked the market in  conjunction with release of the FED minutes and set off a selling wave in TLT and related bond funds.  Here's an article from Schwab Active Trader.  Sorry I can't link to but its a proprietary feed from Schwab:
AAPL may likely be under some selling pressure as Gundlach of Double Capital forecast a price of $ 425, setting off a heated debate on CNBC.  And, to add to the pain, gold is getting hit once again.  Maybe we've seen the highs for the year. (just kidding).
Here's the T2 update...which shows IWM still in #1 slot, although SPY has fallen from grace and should be closed per the stated stop criteria.  Per the rules we have no position in QQQ.
TLT is at the far end of the spectrum, which should be bullish but there's fundamental problems with Treasuries right now effecting the weakness
And, here's another run at an AGG benchmarked portfolio with uber low drawdraws and high linearity (RSQ).  This version also features a much lower volatility (SKEW) and gains some power from SDY and DVY,... the SPY and DOW dividend ETFs.  Note that there are no equity components in the portfolio.