Thursday, February 28, 2013

T6 Update ..2.28.13

The last day of February and one day before the debt ceiling deadline.  But no one seems too concerned about it.  Somehow these crises have always proved to be only a temporary fly in the ointment in the past and the market response to this issue has been to simply ignore it.
The folks at CNBC think its no big deal, just another little speed bump in the markets rise.  It's all about profits and a careful analysis of what otherwise seems like a dismal situation for workers and small businesses turns out to be a win-win for the big banks, big oil and large corporations.
In the meantime, the simple T6 bullish model continues to modestly outperform the SPY.

Note the position of the TrendX SPY in the side panel and the position of the blue equity line vs. the RSQ on the 4 month chart.
These are bullish, until proven otherwise.

Wednesday, February 27, 2013

AB Update...2.27.13

This is the final posting of the variable AB model...going forward we'll focus on the T6 Lab models, which are much more dynamic, have embedded risk controls, and which can be utilized for either short term or longer term portfolios.
Just for comparison sake here are the AB portfolios in both formats and it's easy to see that the T6 lab offers much more oversight ability and closer scrutiny of the model components.  The RM version of AB has failed
to respond effectively to the recent  downside whipsaws, thereby producing disappointing short term returns.
I'm watching Bernanke's live testimony this morning and he's optimistic for the energy and financial sectors, so the DOW has just popped (again).  All the Spyder sector ETFs are green...with XLE (energy) and XLF (financials) leading the pack.  Just a validation of the idea that news really does move the markets.

Tuesday, February 26, 2013

T6 Update ...2.26.13

Lesson 2 on how to adjust the vertical axis of any chart was published earlier today.

The T6 bullish model continues to slot XLU as #1 resulting in a very minor improvement over the SPY on short term metrics.  All bullish indicators....RSQ/Equity cross, P3 and P6 are negative..a condition that has persisted since 2.19.
I suggested yesterday that we were likely to see extra normal volatility until March 1, and so far that scenario has played out.  We had a mini crash in yesterday's last 30 minutes, with a resultant backlash recovery at the open today.  This strength does not appear to be holding (on sub normal volume) but caution and cash are attractive to my positioning right now.
We can see how each ETF in the portfolio has performed short term by examining the component metrics and, as suspected, XLU is the current  bullish outlier.  This is a simple little metrics panel but it delivers a quick snapshot of how each ETF is stacking up.  What we don't want to see is a divergence of the short term metrics and the momentum rankings...then we have to be suspect about the momentum slots.

T6 Lab Lesson 2

This lesson shows how to reset the vertical axis on any chart on any of the Mosaic files...T2, T6, M6 and M3.
For those familiar with Excel there's no surprises and you likely know the simple procedure already .  For others, here's how:

1.  Locate a chart you want to modify and click with the right mouse button on the bottom value of the axis.
2.  You may have to double click (or tap) to open the menu.
     You are then faced with the following panel and "Format Axis" is the option to be clicked on:
3.  This will open the formatting menu and for the vertical axis, just deselect "Auto" and check "Fixed". For the chart in question you could select something like 250 to replace the 0.0 value. Then hit the "Close" button at the button of the sheet and the chart will reset. and the control panel will close.
 Note:  If the axis has dollar values, just enter a whole number..50, 100, 200, etc.
          If axis has percentage values, enter decimal values....  .25=25%, .75=75%,  1.00= 100%, etc
If you don't like the resultant look just go through steps 1, 2, 3 again. Or, you can always reset the Axis Options to Auto and let Excel produce its best solution.
After you do this a few times it will seem easy and go much faster.
Just remember to always keep a backup file of the program in reserve in case things go awry.

Monday, February 25, 2013

T6 Lab Lesson 1

The T6 Lab charts provide 2 different ways of deconstructing a portfolio.
There are grey background charts and black background charts. 
Only the black charts are linked to the metrics fields.

The 2 "Variables" charts with the grey chart fields are linked to the Variables position sizing matrix with the position sizing indicated by the yellow numerals.  You can adjust these numbers (do not adjust the percentage values..they will recalculate automatically) to quickly see how different portfolio mixes affect both the 4 month and 2 year charts. These 2 charts are not linked to the Performance metrics and those values will not change if you adjust Variable sizes.
All the other black background charts, including the Flux chart, are linked together and reflect an equal weighting of the portfolio defined in the TICKERS list.  If you wanted to see the results of the portfolio with a zero position in QQQ, you can accomplish this by simply going to the Data tab and removing QQQ from the Ticker list.
Please note...If you do remove a component from the Ticker list you must fill in that space by moving a lower component into that space.  The Lab will not calculate if there is a gap in the Data tab Ticker list.

T6 Update ..2.25.13

We're seeing a moderate volume downdraft this morning after an opening gap up.  If a debt ceiling resolution is forthcoming a couple hundred point surge is likely but no one at this point is very hopeful for such an event.
Nevertheless, there will be rumors and leaked reports along the way so we can expect some volatility before the dismal deadline is crossed.

GLD and TLT are the beneficiaries of today's weakness but that scenario could reverse quickly.

The T6 version 3 was sent to all users this weekend.  If you didn't receive it send me an email at etfmosaic@aol.com and I'll get it off. 
It been interesting to see XLU (utilities) jump into #1 slot for the past three days. XLU is typically seen as a market neutral index and its momentum reflects concern about the continuing viability of the equities.
For the default portfolio of the T6 version 3 Lab I've replaced IWM with QQQ, but you can run it anyway you please.  The Qs haven't done very well lately as evidenced by the #6 slot for the entire lookback period.
Keep in mind that this is a bullish portfolio with little risk hedge other than XLU.  Going forward we'll look at a bear T6 Lab portfolio so that when you look at both of them side by side it's easier to detect underlying market momentum.

Later today I'll post Lesson #1 for the T6 Lab features.
These lessons will be issued as separate posts with the intent of making them easier to archive and retrieve.

Friday, February 22, 2013

VTV followup & P6....2.22.13

This is a followup to yesterday's VTV post and, as expected, XIV took a hit on market weakness which is now reflected in the short term metrics.
The issue that is worth pointing out is the effectiveness of the P6 slope in seeing this weakness coming...both in XIV and SPY (and IWM as mentioned since last Friday).  At the same time we've seen the P6 go upslope on AGG which is typically bearish for equity markets.  Had the P6 slope guidelines been followed regarding XIV and SPY, any monies in those positions should have been closed by the 19th end of day, thereby avoiding the downdraft over the past 2 days.  These risk management tools actually do work,,,the trick is in paying attention to their reversals and reacting accordingly.

Thursday, February 21, 2013

VTV Update.. 2.21.13

We haven't checked in on the VTV performance lately, so with the VIX up over 25% in the past 2 days this seemed like a good time.  XIV is still chugging along although it is down 5% today and tomorrow's metrics are going to look a lot different.
As of yesterday the VTV TrendX (moving pivot) hit the zero line and the VTV equity curve crossed over the RSQ stop line so its time to book gains for this round and wait for the next setup.
The VTV top 1 volatility is clearly much higher than SPY, which illustrates the danger of this model.  Most investors looking out more than 3 months would do well to minimize exposure to the top 1 model.  

The real value of VTV is still in identifying opportunities in the IWM / TLT divergent pair.  The pair skew has been amazingly correlated over the past 30 days as well as shorter time frames...this is an unusual situation as we typically see some violation of the skew in the various time frames. 
The Long IWM/ Short TLT has been a money maker since the frist of the month when the setup displayed a favorable IWM as rank 2 and TLT as rank 5.
Despite the Wall Street feeling that bonds are not going to do well this year, especially Treasuries, we are seeing a pop in TLT and TIP today, with the P6 now upslope on the TLT...so, time to close the pair trade and wait for the next setup.


Wednesday, February 20, 2013

AB Model..2 Views...2.20.13

To illustrate the differences in the fixed variable position AB model and the T6 Lab approach here is the same portfolio currently updated on both platforms as of yesterday's close.
The differences are...AB has no momentum rotation feature...we just hold the portfolio in the stated proportions and rebalance position sizing monthly.  This is a delta neutral approach with an equity / bond balance minus the influence of the treasuries. This is a slow, steady capital appreciation no turnover tactic.
The T6 Lab approach is more dynamic and may requires more maintenance in term of trading and exercising stops.  The results shown do not reflect implementation of the various stops suggested...RSQ cross, P6 downslope, etc.  since each investor must determine his own risk comfort level and apply stops accordingly.
In the first T6 view (below) our momentum ranking has favored IWM and SPY for the duration of our lookback.  This top 2 setup has required no trading since 1.25.13 and we have managed to beat SPY in each short term time frame through the 30 day period.  The 2 year return has underperformed SPY and that can be traced to periods when the equity curve was below the RSQ and/or the P6 was downslope relative to the equity curve...so active risk management does make a difference.
Finally, here's a snip of the same T6 Lab with a top 6 approach...all in all the time. Our long term returns almost match SPY but with less volatility.  The position sizes are all equal also....which varies from the AB variable model.  You can check out the full nuances of this model on the T6 software at your convenience.

Tuesday, February 19, 2013

T6 Lab Update...2.19.13

The updated T6 Lab's simple bullish portfolio is still focused on XLE and IWM. As mentioned last week these positions are looking toppy using the P6 and stops should be rigorous enforced.
Of the 6 components XLF now looks like an emerging momentum sector, but the extremely low market volume needs to be considered as well as the possible effects of a debt ceiling collapse. 
XLV has been jumping in and out of the number 2 slot recently and here's a fairly detailed analysis of some fundamental issues to consider regarding XLV's reflection of the health care sector.

Over the weekend I made some refinements to the T6 Lab and those updates will be issued as version 3, probably this weekend.  With the release of version 3 I don't foresee any further enhancements to the model anytime soon so the tutorial on its use can proceed without having to adjust for new elements in the Lab.
Thanks for bearing with me as these incremental refinements have been added.  My goal, as always, is to provide a versatile and adaptable testing environment for model portfolios accompanied by risk controls that are easy to identify and implement. 


Friday, February 15, 2013

T6 & Component Update...2.15.13

Here's an update of the "simple" T6 portfolio mentioned previously.  There's no bear component in this mix save for a bit of safety in XLU (Utilities). This is a bull market portfolio and, as we shall see, it may be time to cut our position size or CASH outright.  Short term the model has done well based on the XLE top slot with a little help from IWM and XLV.  The landscape may be changing however.
Below is a closer look at the component charts which you can see for yourself on your T6 platform.
Note what's going on with XLE and the P6 relative to the P3.
Keeping in mind our basic T6 risk management strategy.. P6 upslope= vested; P6 downsloope = cash,
it's time to pay close attention to our #1 slot and pocket some or all of the accrued gains.
We're seeing the same P6 downslope action on XLU, XLV and SPY.

On another note..I've mentioned the apparent consensus on CNBC that Treasuries are doomed this year but here's another point of view to consider from the FA money management world.

What ever comes down the pike we just have to be prepared to adapt and engage a portfolio mix that will keep our capital on the right side of the equity curve and, starting next Tuesday, I'll begin a series of posts to illustrate different ways to use the T6 to help accomplish this goal.

Thursday, February 14, 2013

T2 Update 2,14.13 + Upcoming

This is the status of the default T2 model portfolio with a top 1 screen.
XLE has held top slot for 3 weeks now so not a lot of trading involved on that situation.  We've managed to outpace the SPY with this strategy on a short term basis, but looking at the longer 2 year term an aggressive risk management program would have upped returns significantly.  One example I've talked about several times ....P6 upslope = vested, P6 downslope = cash.
Even in the face to today's market weakness XLE is still in the green and never underestimate the power of big oil to drive the markets...either up or down.  We'll look at a couple pair trade setups that can help confirm the XLE trend next.
There's a lot of short interest in the markets:  Here's an up to date list from BESPOKE.
Nevertheless, most of the CNBC talking heads are bullish on cyclicals, financials and commodities and  bearish on treasuries.  We shall see.

Wednesday, February 13, 2013

AB Model Update..2.13.13

This is a slightly refined version of the AB model.  My goal going forward is to design these models so that they can be run in the T6 Lab and revised and updated at your pleasure.
Note that TLT and TIP (the Treasury related bond ETFs) have been eliminated in favor of municipal, junk and high grade corporate bonds to offset equities.
 The composite charts of the 6 components reflect the positive momentum in all issues...the kind of consensus we want to see. 
We now have a 3 equity, 3 bond model that can be managed on a component by component basis if the P6 and/or RSQ risk lines are violated. Although the historical % drawdown is a bit more than I prefer, that's the price we have to pay to keep up with the SPY benchmark...at least for now.
LM is lagging so far behind the equity curve that we'll shelve the model for now.  The TLT and GLD components have worked against us and the low momentum of the QQQ position as our equity mainstay have also hampered gains relative to the SPY.

Tuesday, February 12, 2013

T6 FX model prospects..2.12.13

Today's Lab looks at the FX (foreign currency) possibilities using the Schwab no commission ETFs. You can always trade Forex if you want to play the currency markets and since these are 24 hour markets it requires a different way to thinking and a different time frame.  Many FX traders make the majority of their trades at 5 in the morning or 1 in the morning (West Coast times).  The interfaces between the European, Asian and US sessions can provide some real volatility and trading opportunities but we're not going into FX stategies right now.
After multiple runs of the T6 Lab and the FX ETFs the best I can say is that the prospects are dim.  Running both a top 1 and top 6 setup fails to produce anything encouraging...it's more a case of losing money quickly or slowly.  FXE (the Euro) is one of the few ETFs that may have some upside legs, but the conclusion of the study is that FXE might better be played as a component in a wider focus T2 model as opposed to part of a narrow sector like the FX markets.
Sometimes its just as important to know what not to trade as what to trade and this little study supports that idea.

Monday, February 11, 2013

T6 Lab + Schwab 105..2.11.13

All registered users of T2 were sent the T6 software yesterday via email.
If you haven't received it please let me know.
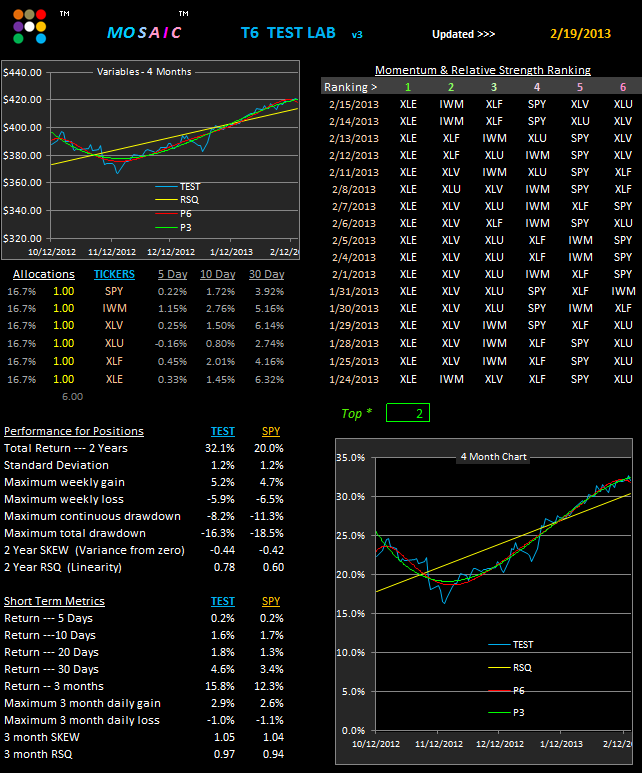
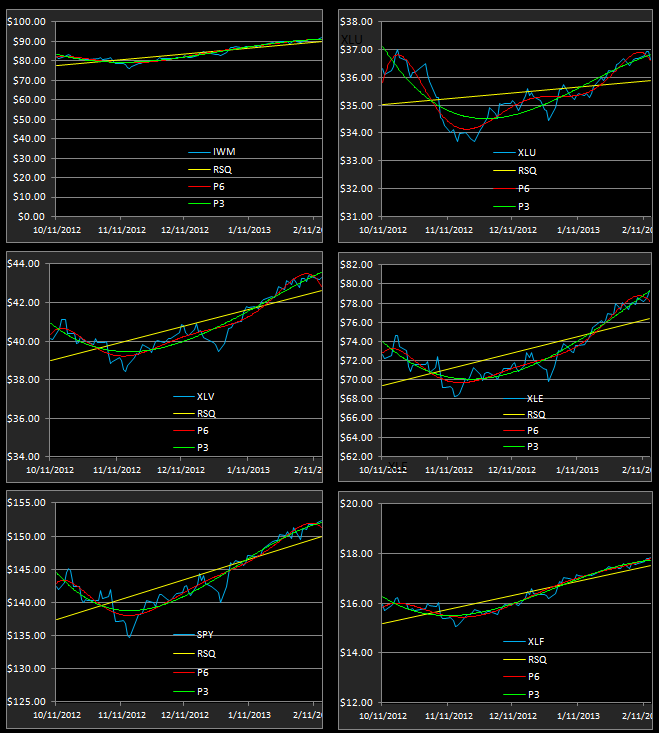
Over the next week or 2 I'll explore in more detail what the Lab model can do, and can't do, as well as provide a few more sample portfolios for your consideration. I've added some short lists of the usual ETF suspects for various categories in the T6 Results tab margin...again just to provide some ideas.

Schwab announced last week that they are now offering 105 commission free ETFs that cover quite a range of sectors and assets.  I've put some screen shots up of those ETFs below and Schwab technical support told me there are no restrictions on holding times, so weekly rotation or more frequently seems to be no problem although there may be some minor fees from the original ETF aggregators (like State Street).

Other brokers are likely to follow Schwab's lead.  Fidelity offers 30 commission free ETFs and that number may climb in the wake of Schwab's move.
The problem (there's always a problem) with the Schwab ETFs is that many of them have very low volume and spreads wider than a few pennies...so the liquidity and slippage factors must be considered.  On the other hand the FX currency ETFs are the industry standards and going forward this week we'll see what type of a model T6 can deliver using these inputs.

(NOTE:  As mentioned before, my display of T6 looks different that yours because I've reformatted the various windows to provide a more readable version on site).
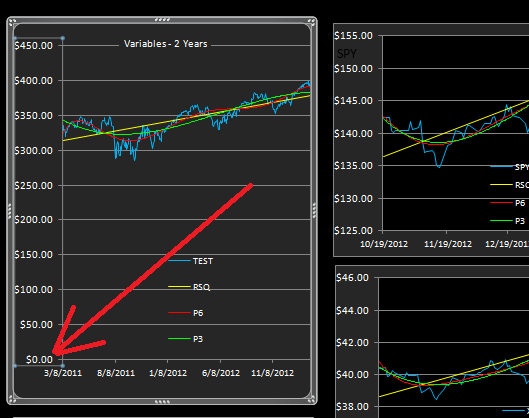
Shown below is the "simple" T6 rotational model I profiled last week.
And now, some of the Schwab commission free ETFs.
You get the idea.  Check out Schwab.com for the full listing.

Friday, February 8, 2013

T2 Bonds & Fixed Income..2.8.13

Today we look at 2 versions of a T2 model of bonds and fixed income issues.  DVY and SDY are the dividend  ETFs of the Dow and the S&P.  They typically run in sync and when they divert its usually not for long.  Many of the large bond fund managers are betting against bonds and other fixed income this year and based on a 2 year lookback the payoff has not been stellar although volatility has been very low (note the RSQ of the top 11 model below.
The two versions cited here are using a top 2 and a top 11 run.  The top 11 also included gains from the SPY and the top 2 run included gains when SPY is in the top 2 slots.
Perhaps surprisingly, just running the top 11 model without SPY produces almost identical 2 year returns with a whole lot less risk
.

Thursday, February 7, 2013

T6 Simple + T2 FX..2.7.13

Here's a simple 6 component model that's been performing nicely.  You can inspect the short term metrics to compare with the SPY.  Download the portfolio into T2 to replicate the study until T6 is sent out this weekend.
On another note, here's a currency based T2 model that may be useful for the purpose of building a composite T6 model based of the top ranked ETFs in each of several portfolios as discussed earlier in the week. Note that silver, gold and oil have been included in the blend.  Gold and oil (crude) are still, in fact, used as currency proxies in some underdeveloped countries with currency problems so their inclusion is a functional one. The Symbol ID values (below) are real time, the T2 model is end of day per yesterday.


Wednesday, February 6, 2013

LM & AB Updates...2.6.13

Our tactical allocation models are starting out the year poorly...that's the bottom line.  It also supports my belief that, although the models worked well in the past 4 years, this year might be different.  Hence my push to refine the T6 methodology in several iterations.
I had a comment yesterday that a simple allocation model would be appreciated and LM and TAQK models were designed with that goal in mind. Going forward however I think low risk capital appreciation may require a more strategic approach. Unfortunately, the crystal ball for 2013 is cloudy...here's one opinion from Seeking Alpha, but there are an equal number that argue for a true bull run this year.  Our goal is to prepared for whatever the market gives us and to grow our portfolios with minimal risks.
To accomplish these ends I intend to suggest several ways to use the T2 and T6 software in the coming month.  This will vary from the simple to the more complex, but with the software tools in hand you are free to pursue whatever strategy suits your needs and comfort level.
Although the Mosaic path has explored varied trails of capital appreciation over the past 6 months our focus has not changed...a modified market neutral model to temper risk and follow up trending investment instruments.  The move to T6 follows that focus and will enable considerably more user control than the LM and AB models, which will also be retired in March since they can be replicated in T6 and tracked on a daily basis without relying on Newsletter postings.


Tuesday, February 5, 2013

The T6 Situation- Revised...2.5.13

With this post we begin a giant step forward in building a unified and adaptive 6 component model that focuses both on short term and longer term risk/reward situations.  To help users realize and implement this approach the new T6 Lab Excel platform will be emailed to all registered T2 users this weekend at no charge.
Our methodology is quite simple and utilizes both your existing T2 platform and the new T6 Lab.
That may sound like a lot of work...I assure you it is not and will hopefully let you feel more comfortable and confident in your investments.

We have already profiled 4 sample 11 component portfolios in T2..the default version 4 model, COM, SA and WS.  These are just my spins on the market and you are always free to build any portfolios of stocks, bonds or ETFs that piques your interest.

We then select the top 1 or 2 momentum ranked components from each T2 model and build a new model in the T6 Lab.  Each week (or sooner if you are so inclined) we run the various T2 models and then update the selections in the T6 Lab to reflect the current momentum leaders. 
Here is an example of that strategy using the top 2 slots from the default model and the top 1 from COM, SA and WS + SPY as a benchmark. 
 
We'll continue to explore ways to further assure the reliability of the T6 Lab approach over the next 3 weeks.
By March 1st our ongoing focus will be one of tracking and refining the T6 Lab format using a number of new T2 portfolios to provide T6 input ideas.

Monday, February 4, 2013

Focus on TLT...1.4.13

Here are a couple studies on TLT, or rather its ultra inverse TBT. Both issues trade about 5 M shares per day and, for option traders, TBT has almost as much open interest as TLT.  Now You might suppose that TLT and its inverse would trade at parity pretty much all the time. That is Up 1% in TLT, Down 1% in TBT.  Turns out that's not a valid conclusion as can be seen by looking at a simple pair study of the two:
While the correlation is high....85%... there are clearly periods of imbalance between the 2 issues and these can be detected and quantified using our Z-score algorithm to produce a reliable 9 day signal over the past 6 months.  The equity curve measured against RSQ is a bit jumpy but the detailed trade report shows how the 15 trades over 6 months made a nice return with only 3 losers.

Those of you who have been following me for the past few years know about the PDQ Dashboard and here's a version focused on TBT versus most of the bond ETFs as well as XLF and SPY.
Both of these scans are based on Friday's close so today's early action (TBT at -2%) has made the point.
The PDQ uses a slightly different algorithm than the MO2 pair study but the results are consistent and the PQD gives more of a consensus view than the simple TBT/TLT study.

The future of bonds is a subject prominent in the news recently as the majority of market gurus are predicting a bond collapse coming.  Here's the view from Pimco' Bill Gross...the world's biggest bond investor.

Friday, February 1, 2013

T2 Study Updates..2.1.13

An interesting interview with Kyle Bass this morning on CNBC in which he noted that the technical long/short correlation of stocks and bonds has fallen apart and continues to deteriorate.  The practical implication for investors is that the search for superior portfolio components needs to be rethought to include different asset groups that are more focused on true capital appreciation potential.  This is a huge subject and we'll touch on some possible areas of exploration in future posts.

Here are updates on 3 T2 models that have been profiled previously:
COM:  a commodity based model
(note the COM benchmark is AGG (bonds) just to avoid SPY as a viable component)
SA:  a model comprised of top ranked stocks from Seeking Alpha
WS: a model comprised of top ranked stocks for 2013 from Wall Street analysts
Note that GE is in the current top 2 slots in both the SA and WS models.
Meanwhile, energy continues to dominate the commodities model.  (IGE is a blend of natural resources)