Saturday, January 30, 2016

Bullish on Financials?....01.30.16

Barron's likes the financials this week and they have been beaten down for a while so maybe there's hope at the end tunnel.  We'll put this into Mosaic context and look at XLF. the SPYDR sector financials ETF and its top 10 holdings, which are not all banks, but they do dominate the % makeup of XLF.  For our first look we'll turn on the 4 day pullback based mean reversion filter so we basically buy the short term lows (hopefully).  And we'll use our default .7% limit stop....which has been the historical median for the past 2 years although since mid December that value is 1.0+ and varies somewhat among the issues.
All things considered M11 did a respectable job over the past 2 years keeping equity linearity high while significantly mitigating drawdowns.  Note that the ALERT is now bullish.
For now the mean reversion strategy is working best but if the XLF components do start to run then switching to the momentum or short term momentum model may offer larger returns.
We'll check in on the model monthly to track how its doing.

Thursday, January 28, 2016

What's Working Now....01.28.16

Here are the M1 mean reversion results for XLU and TLT...some of the best performing models in the current weak, choppy markets.  XLU had a blow out day today...unfortunately the model was in cash but our goal is the longhaul and slow steady income appreciation.
As the old trading sage says," Better to be out of a stock wishing you were in it than to be in a stock wishing you were out of it."
Click once on screens to enlarge.


Wednesday, January 27, 2016

Delta Neutral Best Entry Points....01.27.16

With continuing wide ATRs and volatility swings it should come as no surprise that delta neutral models are currently the best short term investment haven over momentum or mean reversion.
This is apparent to many readers based on the recent flurry of questions on finding good entry points for new positions.  A major concern is identifying those period when the relative skew or premium of each position is essentially at equilibrium with the inverse side of the trade.  On intraday platforms we can simply look at the percentage change in the 2 issues (in the example below XIV vs. VXX)
This disparity may fluctuate intraday but for risk tracking purposes we just track it in daily bars.
It's not unusual to see one side of the delta neutral pair up or down as much as 10% relative to the other.  That is not a good time to initiate new positions as the skew tends to be mean reverting.
Graphically, we can just look at the Premium and Skew charts to determine when risk is at parity.
Those are the points along the  Premium RSQ line and/or the Skew zero line where crossovers occur. These situations provide us with a volatility balanced opening for new positions.

Tuesday, January 26, 2016

MoPonzo Updates on SPY and VIX....01.26.16

This week's Ponzo updates reveal a forecast characterized by odds for increasing volatility as the projected trading ranges have expanded in both SPY and the VIX and perhaps more significantly, the forecast for a steady erosion of the VIX that we saw last week has now been replaced with much more iffy scenario options. We continue to flounder in a sea of macroeconomic uncertainty and are now (for the short term) at the mercy of earnings reports and guidance. Not a time for big positions.


Monday, January 25, 2016

M1 Update on TLT + INSIGHT...01.25.16

We got the bearish short covering reaction that I suspected was coming today after Friday's rally and the NYAD fell dramatically from a close of 7.52 on Friday to the teens today. A bit overdone maybe.
Here's the latest look at the TLT mean reversion model which continues to deliver respectable returns with minimum drawdown.  The flattening equity curve, the short term ALERT and the downslope TrendX suggest momentum is waning however so it may be prudent to scale back positions and await more opportune signal odds.
This week's M3 INSIGHT looks at 2 completely different XLU setups, the later of which is surprisingly simple yet profitable.


Saturday, January 23, 2016

VDX Updates for VIX, SPY, XLU and TLT...01.23.16

A huge short covering rally on Friday may see some erosion on Monday.
Traders Almanac lists the last week of January as the most bullish week of the month and then there's the possible end of month rebalance pop so the odds are skewed for the bulls next week.
Our Ponzo and Long Term resistance chart hit the VIX top at 32 perfectly.  And, if we put any credence in historical patterns via the Ponzo then we're due for a steady volatility decline for a few weeks....maybe.  We just have to update the returns each week to confirm the present outlook.

Thursday, January 21, 2016

Hey!..Wanta Buy Some Risk????...01.21.16

OK, seriously...DO NOT TRADE THESE SIGNALS.  First of all VIX is an index so you can't....you have to trade the options or futures or ETN volatility derivatives like VXX.
That being said...here's the weekly bar chart of the VIX going back a few years and we can see that with yesterday;s pop to 32 the odds are favoring a turn down.
Just to see how that jibed with the M1 Prospector I ran the momentum and mean reversion modes and this is the current mean reversion profile.  Note the hefty limit stop..  Not for the faint of heart.

Wednesday, January 20, 2016

Ponzo Updates for SPY, TLT and the VIX...01.20.16

No hairy bottom this morning as the VIX pops up 11% at the open and the NYAD starts the day at a distinctly bearish .08.  There just aren't any buyers. SPY is down >2% and is below the S2 pivot.
This week's Insight has proven to be a welcome treat for TLT players.
Even the resilient XLU has turned down this morning as suggested yesterday.
The new Ponzo updates retain our previous bearish theme bias for the foreseeable future (30 days) as market prognosticators ponder how low we can go.


Tuesday, January 19, 2016

Looking for Hairy Bottoms ..01.19.16

Years ago I coined the phrases hairy tops and hairy bottoms to describe candlestick patterns that often accompany trend reversals. The "hair" on a hairy bottom is really the extension tail on the candlestick body and indicates that the close is above the low...the extent of which can be judged by the length of the hair.
While it may be a bit early to bet the farm on the hairy bottom pattern currently setting up it is well worth keeping track of its development as this has proven to be one of the most reliable  multiple candle signals.
The screen shot attached is from 40 minutes in on today's market. These are daily bars.
Hairy tops and bottoms are fractal...meaning you can detect them on multiple time frames and day traders of my acquaintance routinely use them on 2 minute bars to gauge waning momentum.

Saturday, January 16, 2016

VDX Updates and More...01.16.16

After a truly ugly week the buzz is whether we still have more downside to come. It's anybody's guess but the China markets are now below long term support and we have or are about to test the September lows in the major indices.
The one sector that's held up above all others is utilities (XLU) and those readers who have continually wondered why XLU is the default outlier in the M3 index models may now see the attraction of that choice.
Our decision to focus on the possibilities for TLT last week turned out to be precocious and if the slide continues there's still room to run.
The VIX is at long term overhead resistance so the odds are favoring the bulls although how long such a reprieve might last is again anybody's guess.
Earnings season has begun and reports and guidance are likely to be the market drivers for the next month.


Thursday, January 14, 2016

Finding Market Leaders with M3....01.14.16

The indices do not move in sync. There is a constant rotation of strength within the sectors and this is reflected in the ebb and flow of SPY, QQQ and IWM (for example).  Since we want to place our trades where the odds for success are highest a simple short term momentum scan of this triad (or any others of your choosing) can frequently deliver a risk/reward result superior to a SPY buy and hold.
Click on picture to enlarge.

Wednesday, January 13, 2016

TLT Mo Ponzo Update...01.13.16

This week's TLT update shows a deteriorating forecast relative to last week.(dotted bar lines) ....similar to what we saw with the SPY chart yesterday but more than a bit odd since we would normally expect a falling SPY to be complemented with a rising TLT (20 year T bonds).
The error percentages are fairly high on these forecast scenarios which in turn leads us to be suspicious of their reliability. The lowest error forecast (orange line) is bullish, as is the best fit line, BUT NOT the consensus average line.

Tuesday, January 12, 2016

SPY MoPonzo Update....01.12.16

This week's SPY Ponzo suggests more volatility to come and a slowly deteriorating market for the near term .  Note that the 2 lowest % error scenarios (yellow and orange) are also the strongest and the weakest mid term outlooks.
The dotted bars up there in the 200s shows where we were the last time we checked. Ouch!

Monday, January 11, 2016

Selecting the Best Odds Paradigm....01.11.16

I keep talking about finding the current best odds paradigm...momentum, short term momentum, mean reversion or delta neutral.
Here's a little study of QQQ showing the current performance status using short term momentum and mean reversion modes.
We look at the 30 day equity curve to help determine out best odds going forward.  This is the equity curve of the model signals, not the the equity curve of the QQQ benchmark buy and hold.
Then we look at the 2 DAY ALERT and the TrendX charts which also relate to the M signal results, not the raw unstopped behavior of QQQ.
If all 3 of these charts show positive slope and the M Equity chart RSQ and P6 are rising then the odds favor continuing in that paradigm mode.
On the other hand,,,,if these 3 performance tracking charts are downslope or neutral then the odds are that mode is not a good choice at the present time.
Side note>  the new M1 platform will be emailed to current M3 users Tuesday after the market close.


Saturday, January 9, 2016

SPY &VIX VDX Updates + TLT Ponzo......01.09.16.

A quick look at the SPY and VIX VDX charts suggests its too late to go short but perhaps a bit early to go long with any enthusiasm even though we are currently sitting precisely on technical pivots.  
The TLT PONZO chart on the other hand presents an attractive risk/reward forecast with 4 of 5 best case fits distinctively bullish ....although there is that pesky purple line scenario to be wary of..


Thursday, January 7, 2016

M11 Looks at DEFENSE...01.07.16

North Korea, Syria, Iran, Afghanistan and those pesky Soviets....jeez... can't we all just get along?
Not likely. With POTUS trying to disembowel the military and the GOP front runners urging a ramp up what are the prospects for the Defense industry?.
Here's M11's objective spin on the largest defense ETF ...ITA ...and 10 of the largest defense contractors. This is a diverse group of defense providers and each has its own idiosyncrasies. Overall ITA has not done very well both short and longer term but a top #2 ranked sort based on momentum has performed appreciably better.  The limit stops are all set to .7% which may or may not be reasonable given the tendency for jumpy prices in these issues.  Nevertheless this study is intended as a jumping off point for further studies and, as always, we recommend using end of day M11 for opportunity studies and M3 real time for actually managing the positions with pre-close trade executions.

Wednesday, January 6, 2016

Delta Neutral Bonds....01.06.16

Back to the bonds are boring theme.  Here's the current delta neutral profile of the simple TLT/TBT 20 year treasury bond pair with no 3rd input outlier.  Note the top # is set to 2 and the TBT stop is a multiple of the TLT stop since its a leveraged inverse.
Our DN approach is clearly superior to a TLT buy and hold strategy (dividend adjusted) although we have not factored in trading commissions.
Note that we have opted for the PCL stop value in lieu of the average as it is closer to the mean.  The TBT stop is skewed a bit also since ultras tend to swing wider than their at par counterparts like TLT.

Tuesday, January 5, 2016

Focus on Volatility....01.05.16

Those who venture into the realm of forecasting and trading volatility are finding it harder and harder to find a quantifiable edge.  That may not be due to the lack of skill on the part of the forecasters but may have more to do with the nature of the tradable volatility instruments themselves.
Here's a link to Bill Luby's observations on the 2015 volatility disaster.  Bill's an old hand at this volatility stuff and is highly regarded in the trading community.  Check out some of his other posts if you really want to get down to the nitty gritty.
Then there's the issue of exactly how these instruments are constructed and this is close to a definitive study of VXX .  The site offers other interesting perspectives and is well worth some time.
To finish off today's volatility ramble here's the latest MoPo of the VIX and the VDX studies of  VIX and VXX..  That purple forecast line on the Ponzo chart should give you a chill.


Monday, January 4, 2016

M3 Format Changes for 2016....01.04.16

We begin the new year with a 400+ point drop in the DOW, continuing the selloff last week and breaking through significant support levels in the major indices.
A huge overnight swoon in the Chinese markets was part of the catalyst and the Euro markets and emerging markets joined in the selling. Today's close will be an important tell for things to come.

For M3 users there are some changes in the new year. The daily pre-close update has been deleted.
M3 users can run their own pre-close update and assess the most promising risk situation.
An ANALYTICS tab has been added that briefly explains each of the M3 platform elements. This tab is designed to complement the USER GUIDE embedded in the M3 platform software.
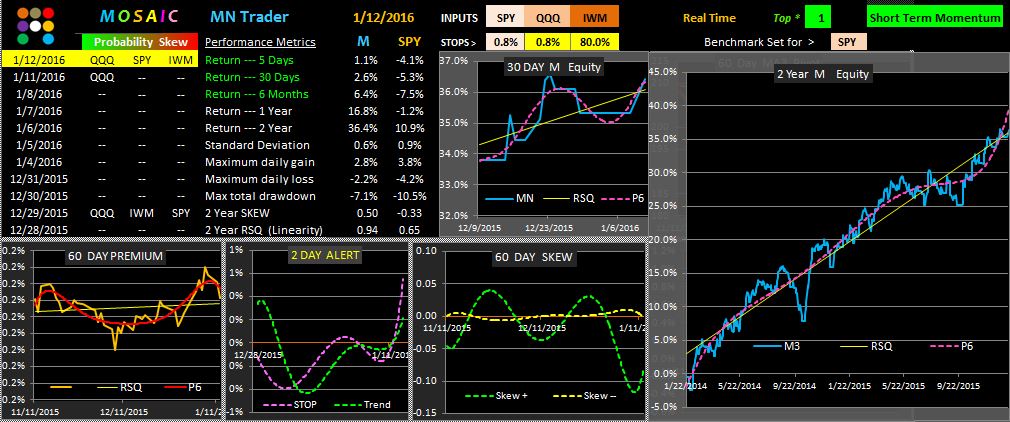
M3 INSIGHT will be posted weekly (sometimes more often) and be devoted to getting the most out of the M3 platform, analyzing the 4 modes (momentum, short term, mean reversion and delta neutral), determining the current paradigm and the likelihood of its continuation or reversal.
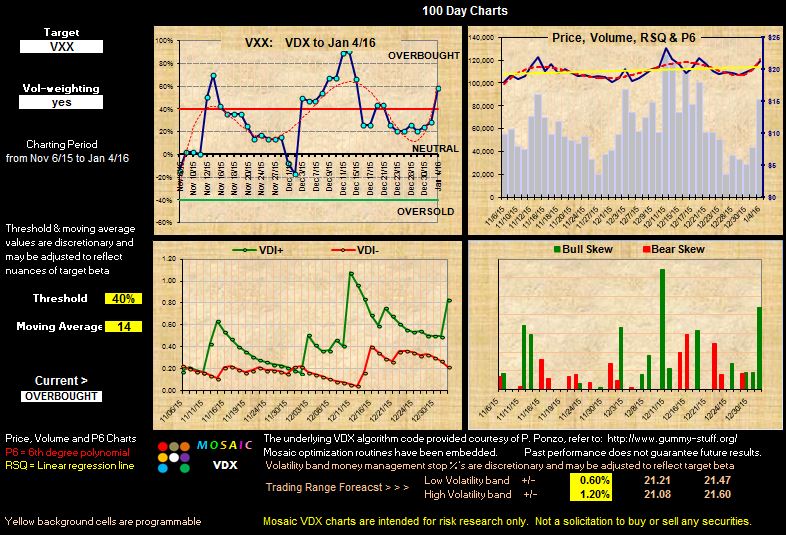
We'll also look at volatility vs. equity setups in M3 and today a case study has been added that looks at the 4 modes of a VXX/XIV pair.  
This is just a starting point for more VXX/XIV studies and, as can be seen from the stop volatility in the 4 panels today, getting actionable and effective values for the stops is job #1 going forward.