
Actionable Risk Opportunities, Tactical Musings and Timing Indicators for Investors
Friday, November 30, 2012
Rebalance...11.30.12
Just a note that today is rebalance day for the LM and TAQK models. In order to maintain alignment with the posted model metrics position sizing in sim or other tracking accounts should be rebalanced per the rebalance calculator you have been provided. Delaying rebalance trades for a day or so Monday typically has minimal impact on net returns since these are delta neutral portfolios.
T2 and VTV Updates...11.30.12

For now equities are leading the charge with Qs, IWM and SPY in top 3 ranks...it doesn't get more bullish than that. FXE in #4 slot supports the bulls case. December is historically bullish... the Santa Claus rally is a real phenomenon and December gains can be impressive...although 2008 was a disaster.
With the Poly5 upslope the current Stopped mode may cancel soon.
Per yesterday's email to subscribers... the RM versions of TAQK and LM are now vested.
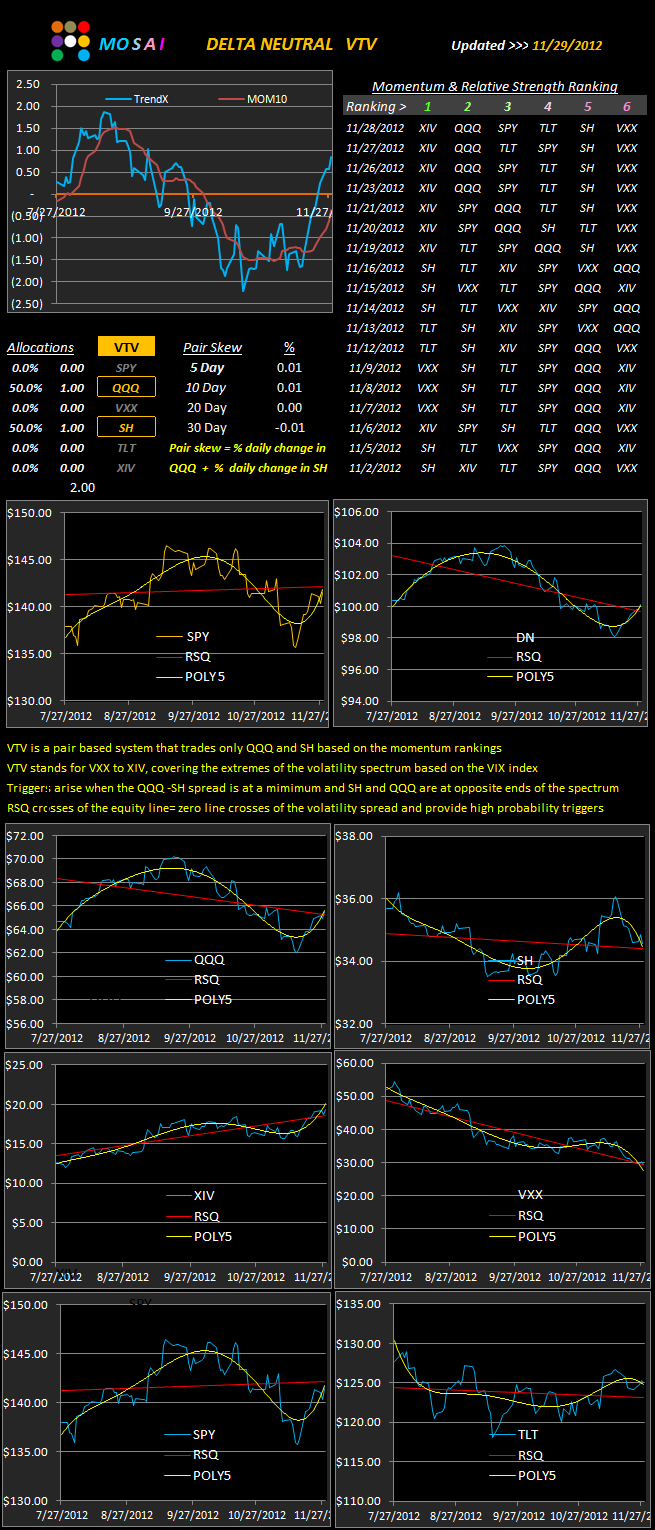
Here's the update to VTV...supporting the bull's case. On the equity side of the model Qs, SPY and XIV all display Poly5 crosses of the RSQ and the XIV/VXX spread remains intact.

Thursday, November 29, 2012
T2 & VTV Updates...11.29.12

The model remains in a stopped mode.
Note that the T2 2 year return has suddenly dropped several % from the previous post while the 5 day returns have basically been flat. Why is that? Because the 2 year metric is based on a floating 504 day lookback period. That means that each daily update looks at a performance period that has an incremental new starting point and ending point (Now).
Here's the VTV update:
VTV is a companion program to T2 but uses a different logic and tactics.
This little stand alone program uses a faster ranking algorithm than T2 and only looks at the volatility spectrum using QQQ and SH as trading instruments. The same STOP controls (RSQ and POLY5) are now shown in the lower chart panels. Basically we waant to be Long the upsloping POLY5 and in cash for the downslope POLY5. The red RSQ line is a "line in the sand" confirmation signal of the short term trend.
Currently, 5 of the 6 components are at the RSQ line.
The component charts are aligned horizontally as inverse pairs: QQQ vs. SH, XIV vs. VXX, SPY vs. TLT to get a better picture of the consensus signal.
Wednesday, November 28, 2012
LM and TAQK Updates...11.28.12

There are no new T2 Alerts this morning. We need a clear sign that the markets are more confident than uncertain until those signals trigger and for now all we have is optimistic comments from the Pres and Boehner that the fiscal cliff will be avoided.
As of 90 minutes in today:
After being down 100 points at the open the DOW has hit green. We now need to see if this positive push will hold. I'm still of the mind that Thursday, Friday and Monday offer the best odds for an end of month rally and for now there are no new Long signals.
Friday is the monthly rebalance day for the TAQK and LM models in order to keep actual position sizing in line with the model allocation percentages

Tuesday, November 27, 2012
T2 Update + 10 charts...11.27.12

We continue to refine the T2 display and all 10 of the component charts are posted below. SPY is not included but is shown with the RSQ and the Poly5 in the panel.
We're getting close to the end of the month...a time of typical market strength...so we may see a surge in the next few days, with the best odds for this coming Friday and Monday.

Monday, November 26, 2012
T2 Chart Format...11.26.12

In order to make the stop or no stop decision making progress a bit more quantified (and less discretionary) this is a new chart format for the T2 (and other model) components. One problem in showing a screen shot of the actual chart file is that I can only show 6 at a time although there are 11 charts stacked up. The intent is to give a description of what is going on. Getting the full power of the chart signals is best accomplished if you have the software in hand, which is just another argument for making the program available to users. This will involve a re-formatting of the whole newsletter concept and I'll be posting on that over the next few days to solicit input and to move forward with providing an analytical package that is truly useful.
The 2 charts on the T2 front panel are based on incremental % change on a daily basis.
The 11 component charts (6 are shown above) are based on daily price fluctuations.
By now you should be familiar with the RSQ lin, which is essentially a linear regression line.
To supplement that line I've added a simple 7 day moving average (orange) and a polynomial (5th degree) (red). The polynomial function approximates the trending behavior of the moving average, but smooths out the signal and provides a clearer view of momentum than the moving average.
When we examine a few of these charts...say QQQ...we see that the Poly5 is a good indicator of imminent momentum. If the Poly5 is upslope price tends to increase, if the Poly5 is downslope then price is fading. Furthermore when the Poly5 crosses the RSQ line, either up or down, price tends to follow suit and we may submit that such a downward cross in any of the components would create a high probability stop.
We'll look at some more nuances of this chart setup as the week progresses while I try to figure out how to show the full 11 chart portfolio in a single screen shot.
Sunday, November 25, 2012
T2 and DN Updates...11.25.12

Gold is making a strong move in the rankings, followed by SPY. The model is still in a stopped mode as technically we are still below the RSQ. That may change on Monday if equities do follow through although they are currently solidly overbought. We will just wait and see.
The pair models are are in an OUT mode.
Tomorrow we'll look at a new configuration of the RSQ stop...to which we've added a polynomial overlay and a moving average component to help display periods of low risk. This newest feature will be included in the T2 software release, hopefully within the next 10 days.
The DN model is shown below....
Looking the spread of the components shows the relative weakness of QQQ is now fading while SH has dropped to the lowest slot. This is a strongly bullish sign and if we can get QQQ into #1 slot we should have a LONG signal on QQQ.

Wednesday, November 21, 2012
LM and TAQK Updates...11.20.12

We're approaching the end of the month with an historical advantage for the bulls the last day and first couple days of the month. We're also poised to surge once a true fiscal cliff solution is approved, which will no doubt be a bit more problematic than the 6 o'clock news would lead you to believe.
The Israeli/Hamas conflict is also likely to drag out for a while despite the tentative cease fire news. This is true guttural hate on display for the world to see and trust is not a virtue easily found between the waring parties.
That leaves a lot of balls in the air, so to speak, and the results will likely produce a dramatic market move...the $64 question is...up or down? For now I'm just chugging along with the signals.
Happy Thanksgiving to all. When you look at whats going on around the world and what's happened in the wake of Sandy and Katrina most of us really do have a lot to be truly thankful for.

Tuesday, November 20, 2012
T2 and T6 Updates...11.20.12

We remain in a stopped mode. If the market does get some followthrough to yesterday's pop there will be plenty of time to get on board. On the other hand, if we see a retest of Friday's lows then cash will be the place to be.
No new Alerts today although we did get some temporary intra day Long signals in QQQ and SPY yesterday which were cancelled at the end of the day and actually went short. It was that kind of day on 50% normal volume and is typical of pre holiday gyrations where smaller traders can move the markets dramatically and short covering can add to the market pump.
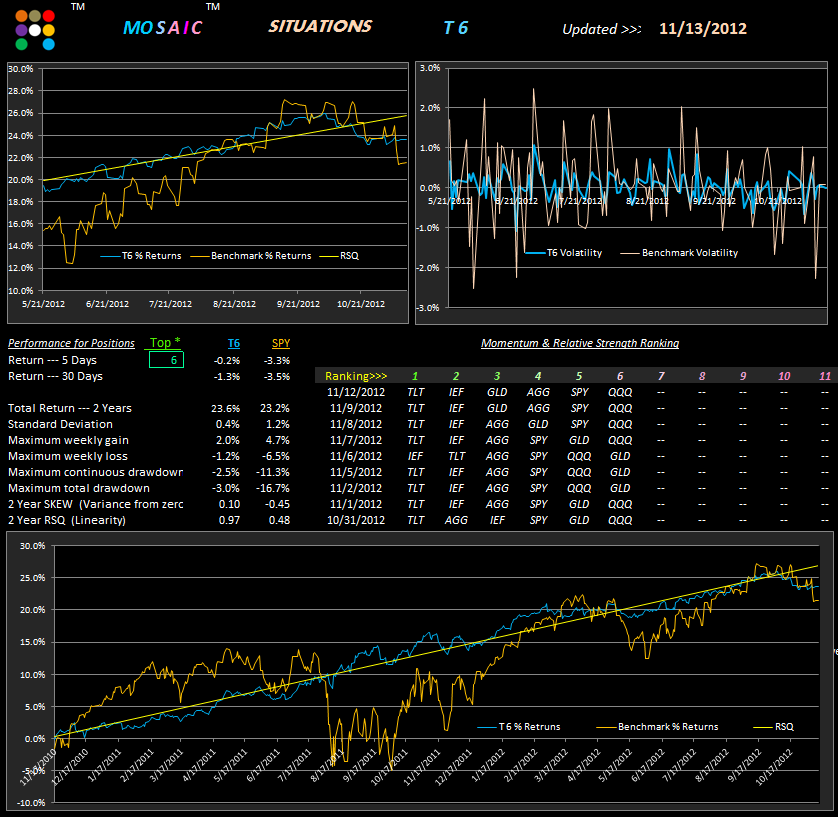
I've included the T6 update below since I know a number of readers have mimicked the portfolio for their own long term accounts. Also check on the post of Nov 13th regarding my RSQ stop comments.
Since you asked: the performance metrics do not reflect activating the RSQ 1.3% stop which has only occurred once (recently) in the 2 year study period. Thanks to Steve for pointing out that the earlier post did not indicate a currently stopped position based on a 1.3% drawdown.

Monday, November 19, 2012
DN Update ..11.19.12

Despite the spate of unknowns...the fiscal cliff, mid-east conflict, etc.. the market is in a bullish mood today...an historical pattern for Thanksgiving week. The Stock Traders Almanac notes that the day before and the day after turkey day have been up days 35 out of the last 37 years....pretty good odds.
AAPL is soaring....up 5% so far today and the materials sector..oil, gold and the basics...are all running strong.
One thing to watch in these rallies is the alignment of QQQ and XLF...tech and the financials. Historically speaking any rally with legs will be led by these 2 sectors and conversely, any rally failure will likely be seen in the relative weakness of these sectors. That's also one of the reasons that XLF is included in the portfolio of ETFs that the DN model is examining for momentum. The relative position of those two ETFs is important in determining the reliability of the momentum rankings...when they are side by side the rankings have more credibility than when they are separated by several slots.
Saturday, November 17, 2012
T 2 Update...11.17.12

Friday's ability to hold a modest gain was supposedly based on the belief that a fiscal cliff solution may be in the works... but we'll just have to see if that's hype designed to pump the markets for the big short sellers or something more substantial. There was medium volume of Friday...an encouraging sign except recall that Friday was also option expiration day, which normally sees good volume as traders unwind positions, pin strikes and play other position realignments.
Net result...we're still in a wait and see mode as the Israelis and Hamas lob hundreds of missiles at one another with the Israelis appearing to have a more precise targeting skill. Over the weekend we're seeing various foreign leaders taking sides in this dangerous conflict so don't look for any quick resolution of this situation, which could get really ugly before a stable truce is achieved....and the markets will probably reflect the ensuing uncertainty.
Friday, November 16, 2012
T 2 Update...11.16.12

I expected the current Israeli / Hamas conflict to generate more selling as the geopolitical consequences of that currently dangerous instability could be substantial. This weekend could see either an escalation of rocket launching or a calming of tensions. Considering the history of this conflict an easy resolution is unlikely. As a result, we may see some more than usual risk avoidance selling at the end of the day and ahead of the weekend.
Apple hit my 525 support target yesterday and is down another $14 today to $ 511. The next support level is quite a ways down...not a good omen.
We've been seeing a selling pattern where the market attempts to gain traction and then sells off the rest of the day (also known as the Pop and Drop). The 30 minute bar chart of the NYSE advance/decline line (NYAD) is one way to see this pattern clearly and the last 11 days of NYAD action are shown below to illustrate.

Thursday, November 15, 2012
T 2 Update...11.15.12

A number of market gurus have been pumping GLD and GDX at these levels, forecasting gold at $5000/ounce within 2 years...a claim we've heard before...but who knows?...maybe they're right this time.
The T2 model is positioned as well as possible under the current market clouds. The only (low risk) way we could improve our returns is with Short status using SH (SPY inverse) or QID ( QQQ inverse).
Yesterday's negative status of TLT was a surprise and the VIX continues to be a head scratcher as both the SPY and the VIX are currently red as of 90 minutes in today.
Biggest loser today is Walmart...down 4%...as the prognosticators wonder about the viable of holiday buying coupled with sub par quarterly sales reports as consumer buying lags globally. May be a buy if it gets back to $60.
Apple continues to show weakness and the $525 line is still a target (currently 529.)..taking us back to the May lows.
Friday...typically a distribution day..should provide some insight into next week's although keep in mind tomorrow is also option expiration and the usual intra day volatility gyrations will likely ensue.
Wednesday, November 14, 2012
TAQK, LM and T2 Updates..11.14.12

Amazingly, the VIX was also negative in early going, although iyt has now flipped to the up side by 1.5%. We have a break (down) in the SPY TrendX (mentioned yesterday) so things could get dicey at this point.
The advance/decline line opened at 2.25 but has now eroded to .31...bear territory. I'm still looking for that 1% day when the advance/decline line crashes to .07-.09 levels....that should be the selling washout that provides the opportunity for at least a short term rally with some legs.
There are no new Alerts this morning. The pair matrix is currently flat all signals.
The RM versions of TAQK and LM remain in cash...which has helped preserve the previous RM gains.


Tuesday, November 13, 2012
T2 & T6 Updates...11.13.12

TLT continues to run while GLD is actually showing some weakness.
Looking at the big picture makes one wonder what catalyst will pull the markets out of the current funk.
Note the TrendX view of the SPY at the right panel.. This is a daily bar real time chart and the outlook is ominous as the indicator hits new lows. Keep in mind that the TrendX is based on the moving pivot of price (H+L+C/3) which gives a more meaningful view of momentum than simply looking at closing values (at least I think so)
For the truly lazy who are interested in the Lazy Man T6 version, the current stats are shown below. While just barely keeping up with the SPY in total returns the beauty of this setup is that you just hold all 6 in equal dollar amounts, rebalance monthly and watch the RSQ stop. You don't even need to concern yourself with the momentum rankings. It's the very tight drawdowns that make T6 an attractive option for those IRAs and forever accounts where capital preservation is a dominant concern.
Regarding the RSQ stop... since the RSQ is so high...97%..the equity line will always straddle the RSQ line, so to avoid whipsawing and still reap the benefit of the RSQ stop one approach is to stop the position when the equity line falls more than 1.3%, slightly more than the maximum weekly loss.
Monday, November 12, 2012
DN Pairs - Part III..11.12.12

Keep in mind that Long QQQ is basically the same thing as Short SH, so these pairs are really only used as a confirmation of directional momentum of our little 6 ETF basket.....it is NOT a portfolio.
The DN model is not concerned with trading anything other than the extremes of the momentum spectrum and since most retail traders don't like to trade short and most IRA accounts don't permit it, the objective is to provide a Long only position whether momentum is bearish or bullish.
Our current outlook continues on the bearish side with SH (SPY inverse) dominating the #1 spot over our 2 week lookback.
As mentioned on Saturday the DN and T2 momentum rankings are in conflict with the consensus of the actual pairs signals, so we're left in a kind of no man's land for the time being.
Nothing says you must be vested at all times so cash is always a viable choice at such times.
In fact, the T2 RSQ stopped and the RM versions of LM and TAQK have turned out to be safe moves over the last month.
As of 8:00 am PST Monday the NYSE advance/decline is in a steady downslope, currently at .75.
There are no new Alerts this morning.
FYI...a topographic view of the QQQ/SH "sweet spot" consistency.

Saturday, November 10, 2012
T2 Update + more...11.10.12

No new Alerts fired on Friday but the caution here can be seen in the current pairs signals shown below...the active signals are all Long equities and Short volatility.
Given this divergence of signal the STOPPED position of the model remains intact.
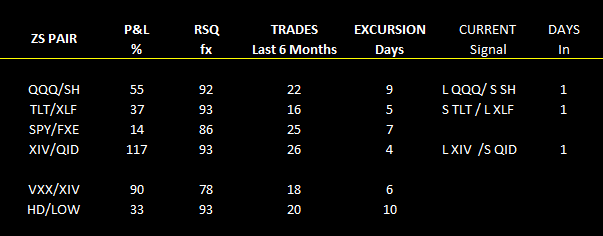
The pairs project is still scheduled for the end of the month. We'll focus on just 4 pairs QQQ/SH, TLT/XLF, XIV/QID and SPY/FXE and use the new Mosaic Pairs Analysis module. These trade signals can change quickly, with an average excursion of just 6 days and the current signals will be posted daily before the close.
Note that I've also included the HD/LOW pair trade..a classsic battle of the titans....Home Depot versus Lowes...with a great RSQ linearity.
The VXX/XIV pair is as wild as it gets and pits the VIX against its inverse. Each of these steroid driven ETFs can move 5 or 10 % per day under the right conditions so we use the pair (for now) as a barometer of market momentum only.
SPY.. S&P 500
SH ...SPY inverse
FXE..Euro
QQQ...Nasdaq 100
QID..Nasdaq 100 inverse x2
TLT...20 year treasuries
XLF...Spyder sector financials
VXX..(actually an ETN, not ETF)..VIX proxy
XIV...VIX inverse
Friday, November 9, 2012
T2 Update...11.9.12

There are no new Alerts.
We're seeing a little bounce this morning, possibly pushed by some short covering but here's the cautions:
1. The NYAD (advance decline line) has pooped out after rising from .34 to 1.25 (slightly positive) and
2. The TICK has trended consistently at the zero line.
The techs are showing some strength as Apple starts to stabilize (maybe). Numerous prognosticators have called it the buy of the year at these levels (no comment from here).
For intra day analysis its always important to be aware of the HFT (high frequency trading) programs running which still account for 70% of daily market volume. A common HFT algorithm buys a short term downtrending market with a heavy presence causing the downtrend to fizzle and reverse. The HFT program then dribbles on more buy orders to give the appearance that the target is improving. Then, once momentum wanes to the upside, all the orders are closed. This whole process can occur in minutes, or less, and its important to be aware that this little market "tickler" can sometimes start rallies with no real underlying foundation, technical or otherwise.
What we haven't seen so far is a high volume capitulation day where the NYAD falls to levels of .07 or below, which would represent true bearish sentiment and selling desperation. That's a common scenario for the turnaround of selloffs of the current magnitude. Best to just watch and wait for now.
Consumer sentiment hits a 5 year high in November while the fiscal cliff showdown looms and a dysfunctional Congress dithers. Somehow, these "crises" have always been resolved at least short term at the 23rd hour and that's the likely outcome here. When it does come expect a whopper rally that will extend for at least a couple days and which likely cause all our technical signals to be virtually useless.
Thursday, November 8, 2012
T2 Update...11.8.12
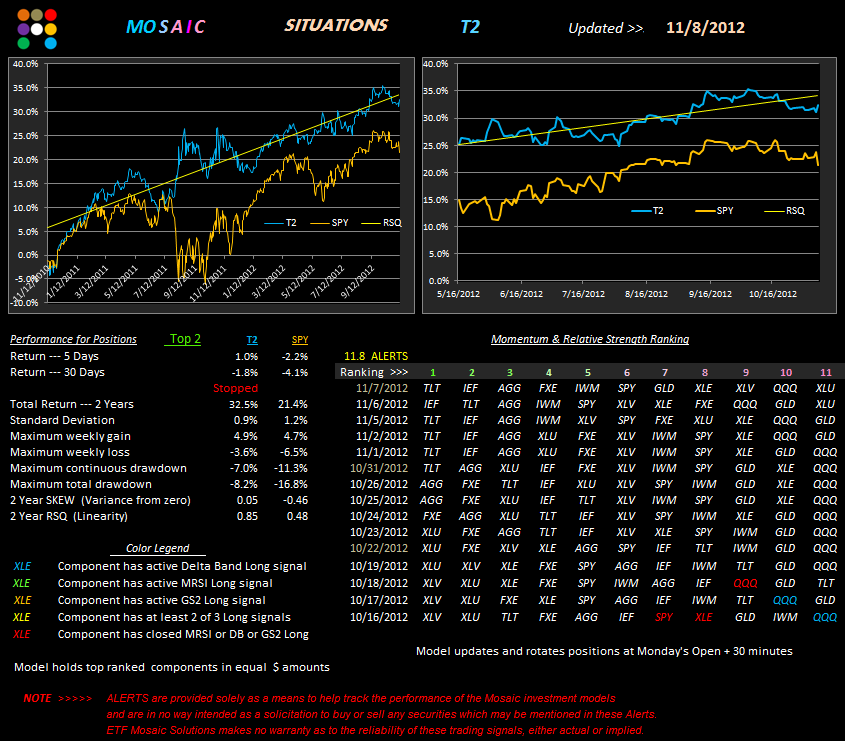
T2 remains in a Stopped mode for now until technical signals improve.
To get a better perspective on whats happening with our T2 components the 11 chart composite is shown below. The bond ETFs are clearly showing the best continual momentum, followed by XLU and XLV. GLD and FXE continue to display volatility while SPY, IWM and XLE follow a similar ebb and flow.

Wednesday, November 7, 2012
LM and TAQK Update..11.7.12

The TrendX signal in both models is improving..a good first sign for a return to a vested position, but for now the RM versions are firmly in cash. The Pending date on the TAQK model should be 11.30.12....the same as the LM model states.
Although GLD has been getting hit lately...as reflected in its low ranking slot...it does manage to pull off occasional spectacular rallies that give the LM model a bit more volatility than the straight bond/equity portfolio of TAQK.
TLT is up almost 2% today...a huge move for our primary bond ETF that has been lagging performance over the last month as money has flowed to equities betting on QE3 stimulus.
With the DOW currently down over 200 points and APPLE -2.5% and falling this could be a washout day so cash is definitely the safe path here.

Tuesday, November 6, 2012
T2 Update + QQQ/SH - Part ll...11.6.12

The January fiscal cliff still looms...the current 800 pound gorilla in your portfolio.
The Rankings are still skewed to bonds as QQQ continues to under perform.
Below is the Market Rewind spin on the QQQ/SH pair mentioned yesterday. This is keeping with our stated objective to develop a small basket of high probability pair trades that can be used in conjunction with the Alert setups and the underlying Top 2 equity curve to generate a low risk revenue stream.

Monday, November 5, 2012
Delta Neutral Pair Trader- Part 1...11.5.12

Why is that? Because this is a great pair trade and over the next couple Mondays I'll try and show you why.
We actually look at 6 ETFs, but only to gauge the current short term momentum in the market...either bearish or bullish. If bullish we're long QQQ (or QQQ calls). If bearish we're long SH (or SH calls). These are short term trades based on the reliability of the QQQ/SH pair's inverse behavior. When that behavior gets out of balance we avoid the trades. Note from the "Pair Skew" metric how that balance has performed over the past 30 days and the DN NAV chart above shows the skew even clearer.
Note that over our 4 year study period the QQQ/SH pair had an average return of 2.28%....which is a good thing because we're not using this as an investment vehicle but a market neutral setup. The RM version had an average return of only .58% over the same 4 year period... a very tight alignment. We can actually improve on these results by changing the allocations from 1:1 to something more efficient..as we will see in future explorations of the pair model. At the same time we can use different ETFs to gauge market momentum and that will also be examined in detail. The beauty of this approach is that we REALLY don't care whether the market is bearish or bullish, we need some guidance from the momentum rankings to keep in alignment with the trend.
For now market momentum remains with the bears as we await the result of tomorrow's election.
Watching last night's "60 Minutes" segment on why the US Senate is gridlocked is enough to drive a sane person crazy...and more bad news...there's no end in sight to this version of a 3 Stooges movie...as us poor
civilians are left to suffer the consequences of a totally dysfunctional Congress.
Saturday, November 3, 2012
T 2 Update...11.3.12

I've added a little alert below the short term metrics to reflect whether the mode is Active or Stopped.
The performance metrics reflect the ongoing results if the model is executed per the momentum rankings.
I'm working on revising the metrics to reflect the results if the RSQ stop is obeyed. It's like keeping a second set of books and is requiring a bit of effort. In the meantime...going to cash when the RSQ line is violated will help keep your capital intact.
Monday we'll look at a new version of the Delta Neutral (DN) model based on the QQQ/SH (SPY Inverse) pair. It's actually a whole separate trading module that may be particularly appealing to option traders.
Friday, November 2, 2012
T 2 Update...11.2.12

Gold and the Euro are getting hit hard today and QQQ is struggling to stay above 0.
The TLT / XLF is OUT (not active) both sides.
There are no new Alerts this morning.
Following the lead of the Mosaic RM models I remain in cash...probably until after the election...when technicals may trump news in driving market momentum.
Thursday, November 1, 2012
T2 Update + T6...11.1.12

The first of the month has produced some buying after yesterday's rebalancing although volume remains very low. There are no new Alerts this morning although QQQ is making it's first positive move in some time.
Gold is showing a little whipsaw as yesterday's positive surge is retracing about 50% as of this post.
Here's a version of the Lazy Man 6 ETF portfolio. No work here...just hold and hold all 6 ETFs in equal dollar amounts. That's it. We don't even need the Momentum Ranking stats. It's the drawdowns that make this attractive. It just doesn't get much lower than this. Better than the T9 model as far as risk and effort goes. Not a bad place to park some of those long term dollars. With an RSQ of .98 you can come and go with this model as you please.

Subscribe to:
Posts (Atom)