

Actionable Risk Opportunities, Tactical Musings and Timing Indicators for Investors
Thursday, October 29, 2015
Silver Ponzo chart....10.29.15
This is the current Mosaic/Ponzo chart for the silver ETF (SLV). I'll run the longer term silver index through Ponzo tomorrow to comopare with the ETF signal. Meanwhile, the dip in SLV today offered an opportunity to put on this credit spread with a much improved risk reward profile...with net credit up to .10 from yesterday's .07 and a lower breakeven point. .. something to consider.

Wednesday, October 28, 2015
A Silver Credit Spread....10.28.15
OK>>>that was a crazy market today as SPY swung from the Pivot to R3 to the pivot and then back to R3. Typical wild FED day with, as almost 100% guaranteed, the FED standing pat. Now we get to revisit the excitement frenzy in December where the consensus odds for a rate hike are about 30%.
Meanwhile, as promised, here's a credit spread, this time puts, for the silver ETF...SLV. Lots of action on the metals lately with a consensus BUY signal from the metrics panel which we'll look at a little closer tomorrow. This looks like a very high probability trade that expires on November 13th. so not a lot of time exposure.


Meanwhile, as promised, here's a credit spread, this time puts, for the silver ETF...SLV. Lots of action on the metals lately with a consensus BUY signal from the metrics panel which we'll look at a little closer tomorrow. This looks like a very high probability trade that expires on November 13th. so not a lot of time exposure.


Tuesday, October 27, 2015
SPY Ponzo Update still negative for the year....10.27.15
After hours Apple reported cheery results but the stock only popped 50 cents so far so the enthusiasm is muted to say the least. Tomorrow is another FED day but the Fed fund consensus for a potential rate uptick is only 6% so the market's pretty written this one off.
SPY Ponzo is still negative for the year and last week's credit spread is alive and well.
Tomorrow we will post this week's credit spread idea.

SPY Ponzo is still negative for the year and last week's credit spread is alive and well.
Tomorrow we will post this week's credit spread idea.

Monday, October 26, 2015
Waiting on APPLE and BABA......10.26.15
Volume was only 50% normal today and a little pullback was expected after Friday's surge. Eyes are on Apple and BABA earnings out tomorrow. Apple was downgraded today and lost almost 3% but if earnings are strong all will be forgiven. BABA was on a tear today, far outpacing the FXI China index and if earnings come in above consensus it could become a real runner with a lot of upside potential. Here's the closing view from M3.


Sunday, October 25, 2015
VDX Updates..Overbought but bullish...10.25.15
This week's VDX updates display the overbought status of SPY and FXI (to a lesser degree). XLU has pulled back from its extreme overbought status and it now almost neutral from a technical standpoint. Note the bullish divergence of the VDI+ and VDI- in the SPY and FXI charts.
And, just because SPY is overbought doesn't mean we can't revisit previous highs before any meaningful pullback. The surge has been all about earnings and with APPLE coming out next week we may see another quick leg up despite tepid forecasts from many analysts. Meanwhile, bullish action by the European central bank and the Bank of China have pushed EFA and FXI into new short term highs. The mood on the street is clearly bullish and the FED's meeting on Wednesday is expected to produce no rate uptick and hence another bullish driver. Then we have the end of the month usual pop and the move into the 5 historically strongest months of the year.
I have been woefully under invested for much of this rally, preferring a more market neutral stance.
The good news is the markets are always presenting new opportunities. We just have to pounce on them at the appropriate time.


Thursday, October 22, 2015
The XLU/AGG 1 & 2 Week Low results....10.22.15
While we wait for the afterhours blowup today from MSFT and GOOG earnings here's a sleeper setup for XLU and AGG using our 1 and 2 week low setups that buy the pullbacks and hold until stopped out or rotated out in subsequent weeks. The real benefit of these systems is the extremely low drawdown compared to a buy and hold strategy. The equity curves are rather attractive also.
It may appear surprising to be able to pull this type of risk/reward profile out of something as boring as the utility sector but the results speak for themselves.


It may appear surprising to be able to pull this type of risk/reward profile out of something as boring as the utility sector but the results speak for themselves.


Wednesday, October 21, 2015
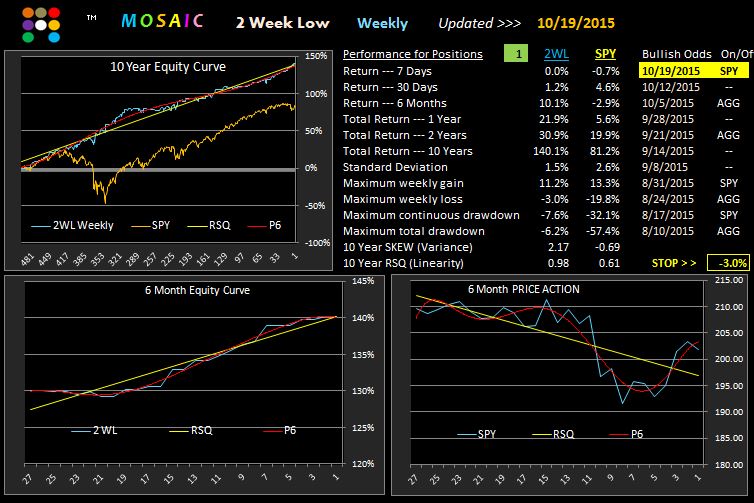
Updates of the 1 and 2 week pullback systems....10.21.15
Here's what the 1 and 2 week pullback systems look like for this week as of Monday's close. These samples use only SPY and AGG as inputs but we'll look at several other permutations tomorrow if time permits. We're just monitoring these setups for now in the face on on-going volatile flux.. Keep in mind these are mean reversion systems, not momentum based and our current choppy markets make the signals somewhat suspect. Note that both systems favor SPY for this week (through Monday's close).


Tuesday, October 20, 2015
Actionable Mosaic Ponzo Credit Spread....10.20.15
As promised, here's the first sample of a Mosaic/Ponzo based credit spread setup.
First we look at the recent MPonzo chart update, as of Monday's close.
Then we examine the 1 standard deviation derived bracket for a bullish market and find the lower bracket value is 207.93.
Then we set up a credit spread with the break even expiration value as close to the lower bracket as possible.
This is a credit spread so we make money at the get-go.
Then we establish stop loss limits so that a strongly rising market does not produce the worse case scenario. (That part is still under study but we're roughly looking to avoid anything larger than a 1% loss.) If the markets do rise then we simply close the positions and wait for the next week's prompts.
We can actually implement a few other money management tactics to control drawdown and those will eventually be merged into the risk/reward control panel.

Monday, October 19, 2015
Ponzo Credit Spread....10.19.15
Here's a few more details on the upcoming Ponzo credit spread strategy.
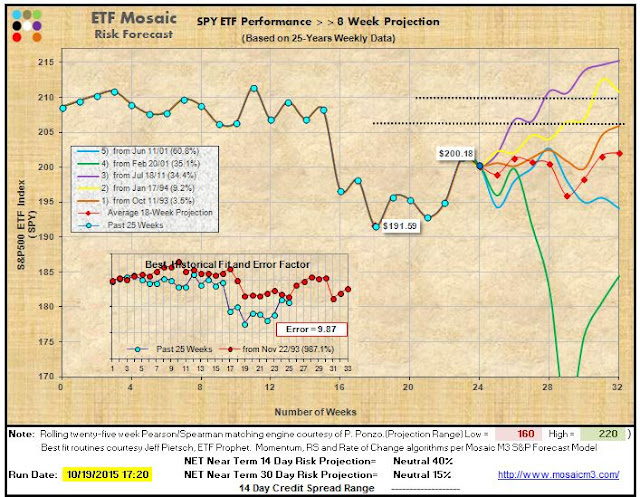
First we check the Monday night weekly update of the SPY Ponzo chart to assess the likely risk profile over the coming 8 weeks, although our attention is really focused on the upcoming 3-4 weeks.
What we're looking for is a consensus signal either up, down or neutral. The stronger the consensus..whether up down or neutral. the better.
Then we set up or down 1 to 2 standard deviations and set a spread bracket. If the trend is down then we sell puts, if the trend is up or neutral then we sell calls...for now these are always credit spreads.
We look for option expiration in 14 to 21 days as this is the period of maximum premium decay and this shortened duration also limits our exposure time.
The example shown below is just that...an example. We can a lot better than this risk/reward trade in actual market conditions
With tomorrow's update of the weekly Ponzo forecast we'll explore a couple potential spread setups using this strategy..


Saturday, October 17, 2015
VDX Updates> SPY,XLU, FXI....10.17.15
This weekend's update of the VDX charts illustrates the market's overbought character, especially in the case of utilities, which we normally expect to be under performing a rising SPY. We are at a significant resistance level both nationally and internationally but the markets appear inclined to buy weakness in spite of less than stellar earnings by the mainstream.
I had a chance to conference call with the chief strategists for 2 of the largest investment banks and their prognosis to the end of the year was (1) neutral and (2) bullish with SPY around 220.
We are about to begin the 5 historically strongest months of the year (November - March) but that didn't turn out well in 08-09 so we don't want to bet the farm quite yet.
Earnings and fear of the FED continue to cause volatility ripples but the VIX is now down to the 16s so the trend is up until proven otherwise.
Next week should be instructive if we break through the current upper resistance levels.
Note the SPY's current status in the TrendX chart in the right side panel.


Thursday, October 15, 2015
New Short Term SPY/GSPC Ponzo Charts....10.15.15
These are brand new Ponzo charts of the SPY and GSPC (S&P500 ETF and Index) that look forward 8 weeks as opposed to the standard models that look forward 18 weeks. The thinking here is that the odds of predicting what's going to happen in the next 8 weeks is considerably better than predicting what the markets are going to do 18 weeks out. And we use both the S&P ETF and Index to check for signal confirmation. Note the extremely low error factor on the Best Historical Fit insert chart.
Compare these charts with the results of the longer term (18 week) SPY and GSPC charts posted yesterday and Tuesday.
SO what do we do with these new Ponzo charts?
This is where it gets interesting.
We're going to be starting a new service using SPY weekly options to create short term credit spreads (2-3 weeks) and over the next week or so I'll explain some of the nuances of this defined risk strategy to complement the M3 suite of models.


Wednesday, October 14, 2015
GSPC (S&P) and QQQ Ponzo Charrts...10.14.15
Per reader requests here are the GSPC (50 year S&P) and QQQ (25 year) Ponzo charts. The idea was that perhaps the GSPC which looks back 50 years might have a different forecast than the SPY ETF which only looks back 25 years (posted yesterday). Turns out they are pretty much in sync although the GSPC does offer some glimmer of hope at year's end. The QQQ chart in contrast is almost bullish although this weekend's Barrons magazine featured several articles that were less optimism for tech, especially PC sales. Keep in mind QQQ is 20% APPLE, which tends to skew the attributes of the other 99 components.


Tuesday, October 13, 2015
SPY Ponzo Update..10.13.15
This week's update of the Ponzo forecast continues the negative theme for SPY for the coming months. Keep in mind the model looks at the current 25 week price action and then looks at the past 25 years SPY price patters to find those scenarios that best match the current action and show what happened in the subsequent 18 weeks.
The short term ( 14 day) best historical fit line has been eerily correct for the past 3 months even in the face of multiple macro and micro economic factors driving the markets.
If you believe that history tends to repeat itself then using the Mosaic version of the Ponzo model may help you navigate the upcoming risk environment. Readers query on how to apply the forecast range and suggestions include selling appropriate ITM covered calls and selling call credit spreads at the outlier upper band strikes if you're bearish or selling put credit spreads at the lower outlier bands if you're bullish.
Using the Ponzo forecast and the VDX charts as a short term trend/momentum confirmation can be very effective.


Monday, October 12, 2015
VDX Updates...10.12.15
With earnings season in full swing the markets are in overbought territory and ripe for a pullback on any bad news from the large caps and/or big tech. China, in the form of FXI, is also overbought although there's been a slew of recent articles in Barrons, WSJ and various hedge fund newsletters touting the bullish prospects for China and the apparent bottoming currently underway. Meanwhile. analysts are also predicting Alibaba (BABA), the darling of IPO speculators last year, could fall another 50%.
Now just put those 2 forecasts together and you will definitely be confused.


Now just put those 2 forecasts together and you will definitely be confused.


Saturday, October 10, 2015
Trading the Paradigm Shifts (Part 1)...10.10.15
The markets move in fractal cycles (multiple time frames) that are neither linear nor easily discerned. As a result, all market models typically experience periods when they perform "in paradigm, or in sync with market dynamics or "out of paradigm" when the models do not perform in sync with market dynamics. Being aware of when the models we are tracking are in or out of paradigm is therefore crucial to maximizing our returns.
In the case of Mosaic M3 we track 3 distinct paradigms >>
MR, a mean reversion model, which basically buys the 3 day low.
MN, a momentum model, which basically buys the 3 day high.
SS, a market neutral model, which uses SPY leveraged ETNs to capture above average volatility.
I say "basically" for MR and MN because there are embedded algorithms in each model that filter for linearity and correlation of the ranking calculations. In times of extreme volatility the models will retreat to cash.
Given the inherent drivers for MN and MR we would expect MN, the momentum based model, to do well in strongly trending markets, whereas MR will perform better in a stepping type of market environment or in a consolidation market.
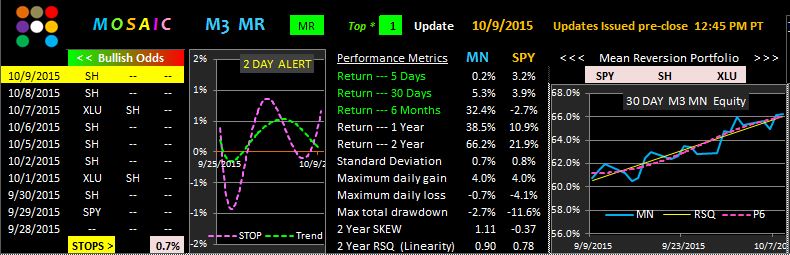
We can detect the current paradigm (and focus our capital accordingly) by examining the performance metrics and the equity curves of each model.
In the versions of MN and MR shown the returns are based on the top 1 ranked positions.
On the daily updates we use a version of MN using the top 2 ranked inputs as our goal is to minimize
portfolio flux and help identify when changes in paradigm are most likely.
Based on a cursory exam of the 2 equity curves we are currently in a trending market. This is confirmed by the MR model which indicates extreme weakness in SH (SPY inverse) and no ranking for XLU, whose appearance in the rankings should provide an early warning for a pending paradigm shift.


In the case of Mosaic M3 we track 3 distinct paradigms >>
MR, a mean reversion model, which basically buys the 3 day low.
MN, a momentum model, which basically buys the 3 day high.
SS, a market neutral model, which uses SPY leveraged ETNs to capture above average volatility.
I say "basically" for MR and MN because there are embedded algorithms in each model that filter for linearity and correlation of the ranking calculations. In times of extreme volatility the models will retreat to cash.
Given the inherent drivers for MN and MR we would expect MN, the momentum based model, to do well in strongly trending markets, whereas MR will perform better in a stepping type of market environment or in a consolidation market.
We can detect the current paradigm (and focus our capital accordingly) by examining the performance metrics and the equity curves of each model.
In the versions of MN and MR shown the returns are based on the top 1 ranked positions.
On the daily updates we use a version of MN using the top 2 ranked inputs as our goal is to minimize
portfolio flux and help identify when changes in paradigm are most likely.
Based on a cursory exam of the 2 equity curves we are currently in a trending market. This is confirmed by the MR model which indicates extreme weakness in SH (SPY inverse) and no ranking for XLU, whose appearance in the rankings should provide an early warning for a pending paradigm shift.

Thursday, October 8, 2015
Looking Forward....10.08.15
Here's a piece by Mauldin (actually Blodget) that forecasts dismal market conditions for the next 10 years. He presents a series of historical arguments to support his case that make a lot of sense...not that market activity makes any sense at all in this highly manipulated environment.
Anyhow, whenever I encounter a problem my immediate response is to try and find a practical and actionable solution. That's just me.
I know a lot of traders don't like to re-balance positions on a daily basis so here's 2 new versions of the old Lazy Man model using just SPY and AGG (Ponzo chart posted yesterday) that trades on a weekly basis (positions rotate at Tuesday's open + 20 minutes).
The first version looks at returns based on positions established after a one week pullback
The second version looks at returns based on positions established after a two week pullback.
Both models use a 1.5% limit stop per week.
If stopped out we just wait till the next week for new signals.
These look like no brainer models but there's actually some sneaky stuff going on in the background and I'll peek at a few of these nuances in future posts, including what happens when you trade the top 2 positions instead of the top 1. .How about that drawdown versus the SPY benchmark buy and hold?


Wednesday, October 7, 2015
The Best Ponzo Chart....10.07.15
As a follow up to yesterday's Ponzo Updates I've been doing extensive research for the launch of the new SIGMA model and in the process I run a lot of Ponzo studies to develop risk profiles for potential portfolio inputs other than the usual suspects that Mosaic has focused on for the past 2 years.
Here is the risk forecast chart for AGG, the IShares Aggregate US bond ETF, and it is hands down the most bullish profile I have yet seen. The risk correlation for the blue and green lines is fairly amazing at +70%. Just something to keep in mind and pujt on your watchlist.
I'll probably be rolling out the new SIGMA model this weekend,

Tuesday, October 6, 2015
Weekly Ponzo Updates...SPY Versus IEF....10.06.15
After a week of bullish activity in the SPY we're seeing the expected pullback today. This is still a news driven market with a variety of escalating risk factors that could swing the markets dramatically either way. On a strictly historical basis Ponzo is presenting a bullish odds skew for the next 2 weeks but after that the prognosis is murkier. The longer term trend into the year's end remains downslope.
This week we look at the SPY forecast versus IEF (IShares 7-10 year Treasuries)....quite a difference!


This week we look at the SPY forecast versus IEF (IShares 7-10 year Treasuries)....quite a difference!


Monday, October 5, 2015
Overbought...10.05.15
With the DOW up 300 points today, The RSI2 at 98 and the VIX below 20 for the first time since Aug 20th the markets are in overbought territory. After 5 up days its time for a pause. The technicals did turn negative in the last hour although price held up into the close. What was surprising was that the VIX was only down 7 percent....we expected a much larger contraction given the sustained bullish action today. If you looked at the Sunday night post (below) you'll note the upcoming economic news reports...some of which may derail the current upbeat mood.
As of 4:30 PM PST (aftermarket 4.5 hours) SPY is down .$.62 in active trading.

As of 4:30 PM PST (aftermarket 4.5 hours) SPY is down .$.62 in active trading.

Sunday, October 4, 2015
An Objective Risk Analysis of NOW...10.04.15
I pass along this probing and objective perspective on current market risk factors and technical signals.
Saturday, October 3, 2015
Surprising Strength and VDX Updates...10.03.15
We had another V bottom day Friday with a heavy hit to the financials in particular. The markets however were not long deterred by a lousy jobs report, perhaps in anticipation that poor economic profiles lower the odds for a FED rate raise. Virtually no one now believes the FED will raise in 2015 and as previously mentioned there's now a local minority saying the odds for 2016 aren't much higher. The past few days have had some tremendous whipsaws and have dramatically illustrated the value of trailing stops for daytraders.
I read a few reports this week by analysts who have a good track record and the emerging view is that China 's woes are bottoming and this may be a good time to at least get a small position going although we should expect some volatility along the way. FXI's hot action on Friday suggests more than a few folks are buying into the buy China argument and the VDX update below indicates that FXI is now almost overbought. What a difference a weeek makes.
Longer term (4 weeks) the US markets are kicking off earnings season next week and after last quarter's sub-par reports the anticipation and fear factor are sure to keep volatility trending up for the next month or more.


Thursday, October 1, 2015
Looks Like Yesterday...10.01.15
Almost a mirror image of yesterday's action...a big V dip with the markets ultimately closing near the open. We're still seeing considerable indecision ...maybe some skepticism that the recent retest of the August low was genuine...or maybe there's a another leg down in the making. The last 15 minutes saw a positive reversal of the downtrend begun 40 minutes preclose. It was a fast market, high volume close and the positive momentum continued after hours with SPY up another .40. This is the reverse of yesterday's aftermarket so it may bode well for tomorrow, which has a bearish bias.
With Ruskie and US warplanes now bombing the dickens out of opposing targets in Syria the odds for a really nasty incident are high....if that happens the markets won't like it.

With Ruskie and US warplanes now bombing the dickens out of opposing targets in Syria the odds for a really nasty incident are high....if that happens the markets won't like it.

Subscribe to:
Posts (Atom)