Monday, August 31, 2015

A Little Perspective....08.31.15

Here's a little lookback on how the summer months have played out so far...  and a reason not to get too enthusiastic about that 1000 point pop we saw last week.  I'm a technical guy about 95% of the time with a healthy respect for the HFTs and those wild and crazy politicos in China, Greece, Puerto Pico, etc.who love to manipulate the markets  By the way...anyone notice that Triparis resigned? Now we'll have a whole new Greek drama coming up.   OK, enough gripping.
This is a 4 hour bar chart of the past 100 days and you can see we basically went nowhere during that period until the last 2 weeks in August when Greek worries worn the markets down and then the Chinese dropped the devaluation bomb and took the SPY down another 15 points just like that.
Now.... the current chart does not look bullish to me.  If, in fact, we see weakness tomorrow and the next day we are more likely to revisit the mini-crash lows..... so caution is critical at this junction.

Saturday, August 29, 2015

VDX Updates..SPY, XLU, FXI....08.29.15

Friday's closing market commentary can be viewed here.
We saw that whopper buying spree that we forecast but the ongoing situation is actually cloudy.
Odds for continued bullish activity are strongest for Monday and Tuesday as the last and first trading days of the month.  After that the September sigma looms but we all know that news surprises have what's been driving the markets for the past 4 months so anything can happen.
I do not like the parallel downslope VDI + and - signals on all three charts...this has resulted in selling in recent past instances. For now we just play our models....which have performed well in the face of recent market turmoil.  After all the panic over China (FXI is the top 25 Chinese stocks...think Chinese Dow) really nothing fundamental has changed other than a devaluation of the yuan by 3 % and a modest lightening of interest rates. The endemic contraction of the economy remains a real issue and we could easily see a couple more legs down before a real uptrend sets in.


Thursday, August 27, 2015

Follow-Through...08.27.15

Another strong day...actually stronger than yesterday based on the NYAD.  2 hours before the close the market makers had a little fun with the rest of us and dropped the markets by a couple hundred points before commencing a strong and persistent buying spree in the close and into the afterhours.
So tomorrow's Friday and we may see some pullback but then next week is the end of the month so there's the bullish odds building.  But then there 's September's stigma as the historically weakest month of the year so it's not at all a done deal that its clear sailing ahead.
The SPY/SH delta neutral setup worked perfectly again today, closing out the SH side just 6 cents from the high and producing a nice net 1.87% return on the SPY side (2.47%-.06%)

Wednesday, August 26, 2015

A Whopper Oversold Bounce....08.26.15

The opening pop of 400 points looked like it was going to crater midday as gains dropped to only 120 points and then....dovish comments by the FED set off some serious buying and drove the Dow up 619 points at the close.  Tomorrow we'll how much of today's buying was short covering and then comes the dreaded Friday which is typically weak to red.
The Ergodics and the ADX were nicely aligned for the afternoon session and volume was about 250% normal ...but I don't think we're out of the woods yet folks.
Note the Mosaic MR  model adopted a delta neutral position yesterday and today...which turned out well with the limit stop on SH firing only 5 cents off the high.

Tuesday, August 25, 2015

Two for the Books....08.25.15

The NYAD opened at a wildly enthusiastic 15.01 and promptly sank all day long...reversing an opening gain of over 400 points to a closing loss of over 200 points.  That's a Trap Door setup that will go down in the books as one of the worst....ever.   Nothing like a 626 point intraday swing to keep your blood pressure up. Pity the poor guys that placed buy orders intraday in their mutual funds as the market rallied and then got filled at the close.  That's one reason I would NEVER, EVER buy another mutual fund.  There's a couple other reasons but ETFs are so much more attractive than mutual funds that I have a hard time understanding why they still even exist.  (just my opinion of course).
Here's the latest SPY Ponzo based on Monday's close and the forecast is somewhere between grim to dismal.  I'm not trying to be flippant but keep in mind that the Ponzo is based on what's happened before over the past 25 years when SPY has encountered current price action. Caution, caution, caution ..... 

Monday, August 24, 2015

One for the Books...09.24.13

Futures were down hard Sunday night (China was down > 10%) and with over 25 million SPY shares trading BEFORE THE OPEN odds were it was going to be bad. The NYAD opened at .01...I don't ever remember seeing a number that low.   S&P futures limited down and were halted along with a slew of other issues while the beloved VIX jumped over 50%.  Not a happy situation when the market plunges 1100 at the open (unless you're short). With tech leaders falling 8-9% and many of the large caps looking terminal the markets began a slow crawl out of  S6 levels up to S3 and eventually S1 (for a while) before turning back down in the afternoon session and closing hard, fast and down on huge volume (4 X normal).
 Now the bad news.  Historically speaking, plunges like today's tend to revisit before achieving a meaningful and sustained recovery....hence we will be on the lookout for the telltale "hairy bottom" candlestick pattern over the next few days which may signal a possible recovery.
The SPY chart below does not begin to impart the drama that accompanied today's action...

Saturday, August 22, 2015

VDX Updates +......08.22.15

With the VIX popping 25% on Thursday and then 46% on Friday its now at long term resistance levels.  That should serve as some sort of comfort to battered bulls but in reality we could see a couple more legs up in the VIX before that beloved hairy bottom pattern appears.
Now we have to be concerned about opening rallies that turn into Trap Door setups and the misery and loss of capital that ensues.
Hey!....I'm normally a pretty upbeat guy but this is serious stuff.... and.....just to add to the worry beads...September....just 10 days away.... it typically the weakest month of the year.
So what do we do?   Cash is king right now.  There was a little afterhours pop in most issues on Friday but we talked about this before....the big prop shops love to goose a falling market into the close just so they can sell it down hard the next day...so we have to be wary of false reversals.
Here's a look at 4 VDX charts...SPY, FXI (China), FXE (Euro) and UUP( US dollar).Aggressive traders may want to focus on the FXE/UUP pair either as ETFs or in a Forex context if you trade currencies.  China has been slammed again and again and again but the bad news is I don't think we seen a bottom there yet.

Thursday, August 20, 2015

Schwab no-fee ETF model updated.

This is the follow up a previous Schwab no-fee SCHB model post.
Keep in mind that the model strategy buys 3 day lows and hols until that 3 day low price is exceeded...and we use a .6% limit stop to contain drawdown.
We noted in the previous post that although the one year returns were attractive the 2 year returns lagged a buy and hold approach.
(recap shown in first table below)
So how do we improve overall returns?  The answer is quite simple.
We track the performance of a buy and hold momentum model versus our 3 day pullback model.  When price momentum is surging we suspend the 3 day low filter and just follow a buy and hold strategy but still applying our .6% limit stop.  How do we determine when to turn the 3 day filter on?  We use a simple net difference chart of a buy and hold versus 3 day low prices and then apply a second degree polynomial (the code is resident in EXCEL)...which yields a powerful graphic indicating the highest odds for either approach (red line sloping down means follow buy and hold, green line sloping up means our 3 day low model has the advantage for superior returns.)
The results of applying this rather simplistic tactic to improve investment returns are shown in the second table and chart below.
Yes...the graphics show SPY, but the exact same returns are generated when we use SCHB.  And they say there's no free lunch.
For the next month you can see other trading ideas similar to this for free at the Mosaic site.  The login password has been suspended so you can follow the daily market updates at 12:45 PM PST


Wednesday, August 19, 2015

UGLY...08.19.15

SPY dropped to S6 or S7 depending on various pivot calculators.  SPY volume was WAY up (166M)...a lot of it in the last 30 minutes with a million shares a minute and most of it on the sell side.
China got whacked again overnight and the VIX jumped 10% (15% at one point),  There was an afterrnoon rally back up to the pivot which held for exactly 2 minutes before plummeting to the depths once again.
Signals are red for Thursday but the resistance line for the VIX  has been hit and so the odds are anything but sure.  The SSO/SDS model worked perfectly today.


Tuesday, August 18, 2015

Buying 3 Day Lows.....08.18.15

We had a little pullback today.  China was down 6% overnight and we'll look at the dismal state of the FXI chart later this week to try and find a trading edge. The NYAD was weak all day and volume continues to be about 50% par.  The close was weak and XLU finally closed in the red after an amazing run for the past few weeks (it may still run for a bit)..
On the heels of the Schwab no-fee ETF study here's a REALLY simple model that buys the 3 day low on SPY and holds until the 3 day low price value is exceeded.  We apply our typical .6% limit stop to contain drawdown.  AND...we have a simple technique to goose our otherwise anemic performance during the first of the 2 years tracked.....to be discussed tomorrow.

Monday, August 17, 2015

Hope Springs Eternal...08.17.15

SPY enjoyed another green day today making for the first back to back up days in August. Initial economic reports were negative dropping SPY to sub S1 levels at the open...but then the market's bizarro logic kicked in and the news feeds announced that bad news was actually good news since it diminished the odds of the FEDS raising rates in September.  Since its an open secret that the financial sector is betting all in on rising interest rates to fuel their earning next year the markets reversed course ...again on low volume...and shot up to R1...ultimately closing on R2 and now solidly overbought with an RSI2 vale of 98 (out of a possible 100).

Saturday, August 15, 2015

VDX Updates + Access to M3.....08.15.15

Here are the current VDX charts for SPY, XIV and XLU.  We had a pause on Friday with a mildly bullish finish although volume was well below normal.  Note that all three charts have both the VDI+ and - downslope.....a warning sign we've discussed in previous posts.
This coming week has mixed prospects according to our M3 dashboard, which is now free access for the next 6 weeks.
XLU, which is a widely regarded safety net, is extremely overbought and Treasuries (TLT) have also climbed much higher than most traders expected.
We'e coming up on September, often the worse performing month of the year...just something to factor into your investment plan,  Meanwhile, the short term trend in down.


Thursday, August 13, 2015

Momentum versus Mean Reversion....A Case Study.....08.13.15

Traders often struggle when attempting to figure the advantages of momentum versus mean reverting market strategies.  Here's a comparison of the two approaches using our Schwab no-fee portfolio model + XLU (SPDR sector Utilities ETF...not no fee). SCHB is a proxy for SPY, SCHX is a proxy for the NYSE large caps. SCHH is a REIT proxy and SPLV is the S&P low volatility ETF.,
Just to compare apples to apples we've using a 4 day positive momentum algorithm for the MM (momentum model) and a 4 day pullback algorithm for the MR (mean reverting model).
We rotate positions at the close of each day and apply a .6% limit stop at that time.
The results span a 2 year lookback period and may be surprising to many given the strong market momentum we have seen during that period.  The mean reverting model produces superior results in terms of linearity and max drawdown although short term returns lag a bit. Obviously the 2 models have entirely different views of market opportunities as can be seen by looking at the rankings of each model.
What's interesting is that we can generate a fairly reliable revenue stream using either one.


Wednesday, August 12, 2015

A Wild Ride....08.12.15

There's a Prozac day.  After dropping like a stone to S3 within the first 90 minutes SPY began a slow climb out of the abyss to final finish the day dead on the pivot and pennies away from yesterday's close.  The $64 question is of course...what happens tomorrow?  The recovery was ostensibly the result of various talking heads claiming the drama over the devalued yaun was way overdone and that things would be fine in the longrun...or it may just have been the HFT robots playing games.  Regardless, volume was about 20% above normal and the Ergodics/ADX convergence suggests that really buying was underway. Thursday will be interesting but then we have Friday, which is hedged to the bearish side. The transports remain weak which is bearish.

Tuesday, August 11, 2015

No follow Through...08.11.15

China's decision to devalue the yuan by 1.86% overnight (the largest on record and the biggest drop in 20 years) created a major ripple in the markets with a major effect on the emerging markets (EEM).
Apple was also hard hit based on news of  Chinese firm that's sucking the oxygen out of Apple's Chinese market.   This isn't new news it's just being pumped with a huge negative impact on Apple.
The markets basically gave back Monday's gains and more in some sectors.  The updated Ponzo chart below reflects Randy Frederick's comments this weekend that high volatility should be expected over the next 6 weeks...September tends to be the worse performing month of the year...so caution is key at this point. We now have an almost equally balanced long/short risk forecast on the SPY.

Monday, August 10, 2015

The Value of Stops...Part 3....08.10.15

There's apparently some confusion about the SSO/SDS model posted last week.
Here are the rules in a nutshell:
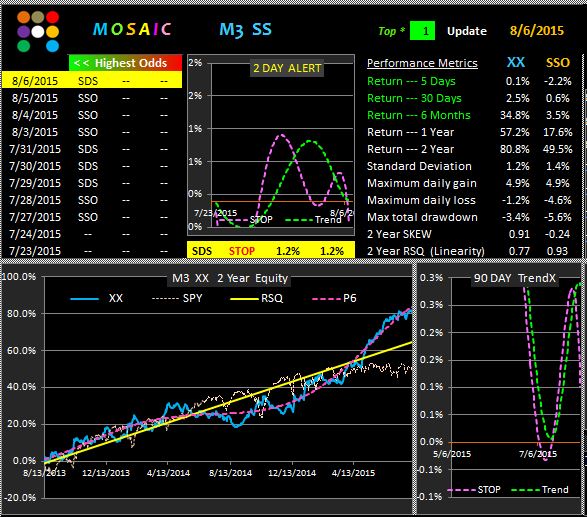
1.  Each day at the close have equal dollar amounts of both SSO and SDS.
2.  Place a 1.2 % limit stop on each position
3.  Return at the end of the next day and repeat step 1 if one of the positions has been stopped out.            That's it.
Our goal is a steady income stream with very little drawdown.
We use a market neutral ,smart beta tactic to accomplish our goal.
We use the 2x leveraged SPY ETFs to increase beta and hence our potential return.
The model makes money whenever daily volatility exceeds a defined "normal level", which actually varies over time as the mean of VIX fluctuates.
Today the model generated 1.2% gain on the SSO side = .6%  based on total capital at risk.
A lot of days nothing happens because the volatility range doesn't trigger the stops.
On those occasions we just sit tight and wait of the next day.
It's the strategically placed stops that make this model work.

Sunday, August 9, 2015

VDX Updates....08.09.15

Here are the current VDX updates for SPY, XIV and XLU.  Unfortunately we've seen this profile of SPY before, not really in the BUY zone, but tempting.  Watch out if the VDI+ and - both swing to downslope....that turned out bearish before and is likely to do so again.  XIV is, well, XIV and subject to a different set of rules than SPY.  XLU is overbought, but not a short candidate.
This is the weekly update from Randy Frederick, someone whom I respect and know personally to be the real deal. His view is basically neutral but things could get worse before they get back to a neutral position for the rest of the year.


Thursday, August 6, 2015

The Value of Stops...Part 2....08.06.15

Following yesterday's post on the use of limit stops here's a simple market neutral model (second panel) that you can use with a defined risk and minimal drawdown.
The inputs are SSO and SDS, the leveraged 2x ETFs up and down of SPY...so you get a beta advantage of  2 and the fixed limit stop is 1.2% (twice our normal stop size for the SPY)
As you can see, this strategy pays off handsomely in the long run. You don't need to look at charts, you don't even need a computer, just a line to your broker to place the order at the close of each day.  Set it, forget it.  Wait till the end of the day and do it again.  No sleepless nights here.

The first panel uses SSO and SDS with an optimized mean regression algorithm filter.
The model rotates into the top ranked issue at the end of each day and sets a 1.2% stop.
The second panel buys both positions in equal $ amounts at the end of each day and sets the same 1.2% limit stop for both positions.

In both cases we've used  SSO as the benchmark for performance.
Note the differences in linearity and total drawdown.


Wednesday, August 5, 2015

The Value of Stops..Part 1...08.05.15

I put a heavy emphasis on the use of stops and in particular I favor the use of intraday limit stops which allow a little breathing room for stocks/ETFs to recover from morning plunges.
This is first in a multi-post series which will make the case for using these stops and, more importantly, how you can easily construct a risk defined trading program using either a single input or an input and its inverse, when such vehicles exist. Such market setups are termed market neutral strategies and are a favorite of many hedge funds and money managers.  (Coming tomorrow).
Rest assured these setups are not difficult to create and/or maintain and it may surprise you to see how easy it is to construct a basket of divergent pairs to cover a variety of sectors.
Today we'll just look at 3 popular ETFs....XLU (SPDR Utilities), QQQ (NAZ 100) and TLT (20 year Treasury bonds).  We compare 2 sets of metrics for each issue...one for the raw ETF performance and the other (LAB) applying a simple .6% or .5% limit stop.  How do these values get defined?.  I use a little algorithm to look back 2 years and define daily range of any issue and then determine the value of a limit stop that will fire >95% of the time without giving up excess gains.  I think you'll see the potential here in the reduced drawdowns, enhanced gains and linearity in each case.


Tuesday, August 4, 2015

Still Worse Than It Looks...08.04.15

The Markets couldn't get any traction going today, instead treading water most of the day and closing weakly with more selling in the after hours session. The M3 models are obviously skittish and all are in cash...a very unusual situation.

Monday, August 3, 2015

Worse Than It Looked...08.03.15t

So much for bullish behavior on the first trading day of the month.  August is typically the worse month of the year for that behavior but this was the worst first trading day of the month in 2 years.
Apple sold off particularly hard....down 3% at one point.  SPY spent most of the afternoon session down at S3 and the persistent negative TICK were a setup for another leg down ....but there was some recovery into the close although the technicals were awful.  XLU continues to shine as our #1 position but, as pointed out this weekend, it is seriously overbought.
Look back to this weekend's post of the SPY VDX and the comment about the parallel and downslope VDI+ and VDI- over the past 2 days. If we ever see this pattern again we'll know to be very wary of any bullish prospects in the near term.


Saturday, August 1, 2015

Schwab no-fee model and VDX Updates...08.01.15

If China's on your info radar then you might want to check Mauldin's recent post.  The before and after photos of Shanghai are an eye-opener and his Chinese economy forensics are factors to consider if you have an exposure in that area.
Here's an update to the Schwab no-fee ETF model since several readers have asked about it.  You obviously have to have a Schwab account to trade these for free and you can now trade them intraday for no fee although the model reflects our usual strategy of buying on the close as selling or holding according to the next's day ranking. SCHB is the proxy for SPY, SCHA is the IWM proxy, SCHD is the SPY dividend proxy, SCHX is the NYSE large cap proxy, SPLV is a low volatility version of SPY. All have decent daily volume (>250K shares) and 1-2 penny spreads. We use an across the boards .6% limit stop per our other M3 models. Just something to consider, not an advertisement for Schwab.
Here's a version that includes XLU (SPDR sector Utilities ETF) (NOT no-fee)
And here's and update to the SPY VDX and teh XLU VDX.  I show the XLU version in response to readers questions as to my comments that XLU is overbought.
Note that the VDI+ and the VDI- on the SPY chart are both downslope.  THIS IS VERY RARE, reflecting technical instability and likely warning of a big move ahead.