Tuesday, April 30, 2013

T6 Lab Update..4.30.13

Markets are in a dithering mood this morning as Apple and MSFT continue to show gains, making the Qs the ETF of choice, at least short term, although it's still stuck in slot #3 in our model. 
On the T6 bull model we are seeing a downslope P6 on the 3 month chart...reflecting the short term (0-10 day) under performance relative to the broader SPY.
On the longer term metrics the T6 is showing its edge as XLU holds fast and XLF and XLV vie back and forth for the #2 slot.
Click once on chart to clarify and enlarge.

Monday, April 29, 2013

T2...4.29.13

Almost the end of the month so we're expecting a little positive action as we cross the cusp.
Both bonds and equities are up in early going..as reflected in the top 2 sort favoring XLU and TLT, a situation suggesting market consolidation or moderate pull back.
QQQ and XLE are picking up some momentum based on Apple and MSFT strength.
XLF is so far not following thru to the upside, perhaps in need of a rest before further gains.
Click once on chart to enlarge and clarify.

Friday, April 26, 2013

T2 All In bonds & Fixed Income update...4.26.13

In the midst of recent market volatility here's an update to the boring Bonds and Fixed Income model with an all in top 11 sort.  No frantic momentum trading here, just a monthly rebalance of capital to assure that equal amounts of capital are allocated to each position.
Its the drawdown and high RSQ that make this model attractive.

Also of note....yesterday's update of the Commodities model and the bump of UNG out of the top 2 mix was timely.
UNG is down over 1.5 % today and looks technically poised to take an even bigger hit in the next few days with the first line of support about a dollar away.
Click once on chart to enlarge and clarify.

Thursday, April 25, 2013

T2 Commodity Model drops UNG...4.25.13

A change in the Commodity model rankings has pushed UNG into the #3 slot for the first time in 2 months. This may be a product of XLU's extreme linearity rather than UNG weakness, but the momentum rankings are clear.
Here's a close up of XLU versus UNG, showing in detail the recent  turn in UNG and the continued drive of XLU...even in the face of recent larger market indices weakness.
This doesn't necessarily mean UNG is going to decline significantly.  It has enjoyed an incredible run up and is due for at least a rest and pull back to the RSQ line before possibly beginning another leg up.


Wednesday, April 24, 2013

3 Minutes and $136 Billion....4.24.13

Short and nasty...phony tweet drops $ 136 Billion out of the S&P in 3 minutes.  Do you think the scammers might have had some massive short positions before they sent this off.  Or even better, short the tweet, Long 2 minutes later to catch the rebound.  This is exactly the scenario from the movie"Trading Places" with Eddie Murphy, a movie I've probably seen 20 times.
To compound the nervousness Schwab servers were hacked and shut down for the last 40 minutes of the day...completely removing ANY electronic access to Schwab and the phone lines were backed up for 30 minutes so trading was impossible on any of their 3 platforms unless you had an institutional account.
Here's the action in real time on the advance/decline line. 
Every stock in the NYSE exhibited the exact same pattern...only in dollars.
Sometimes the slow and easy approach of trading the near close and the near open show its advantages.

The much anticipated APPLE results were a mixed bag, leaving a net sour taste in investor's mouths for this morning open, but MSFT is on a run to new short term highs and GE's regaining ground so we may seem some strength and a test of previous highs by month's end. . 

Tuesday, April 23, 2013

T2 X Sector Model Rolls On...4.23.13

The market loves Netflix...up 25% today on blow out performance.  And, then there's anticipation about Apple, reporting after the close today and up 2% for the day..406.50. 
We're seeing a little fade down of the advance/decline line at the noon lunch hour (east coast time), but the real action probably won't occur until the after hours session.
Meanwhile, the Spyder X sector ETF model has been slowly chugging along....still focused on XLU and XLV for the entire look back period...so not a lot of trading required to stay in the loop with the top 2.

Monday, April 22, 2013

T2 Default Seeks Safety...4.22.13

The T2 Default model is favoring TLT over the past 4 days and today's early action suggests more of the same to come.
Apple reports tomorrow so we're seeing a little anticipation pop although price is still below $400. If AAPL misses in the same manner as IBM the results could be a 50 point drop. Not a play for the faint of heart.
GLD, XLE IWM and QQQ remain in a lagging mode although MSFT is a runner....the biggest gainer in the DOW and second biggest gainer in the Qs today.
The lower beta bonds IEF and AGG have moved to the center of the rankings and XLU continues to show positive momentum...for now, thereby suggesting a move to the safer issues. 
All indicators are positive on the 2 year chart.
On the 6 month chart the equity line is riding the RSQ and the P6 is downslope...not an ideal time for the deployment of new capital, but rather a time to take some previous gains and await a more favorable technical scenario.


Friday, April 19, 2013

T2 Bonds &FI with a twist...4.19.13

Here's an update of the Bonds and Fixed Income portfolio but this time we've made SPY the benchmark in lieu of AGG and incorporated SPY into the momentum ranking calculations.  The model sort is set at 11...meaning all in all the time. 
We just have to rebalance every month to maintain equal dollar amounts in each position.

The results over 2 years show an RSQ of .97 (1.00 is a straight line and the highest possible score), but the real attention getter is the drawdown numbers.  The results look similar to the T6 delta neutral based model shown yesterday, but this is a more diversified portfolio of opportunities and associated risks.

We actually don't even need to look at the momentum rankings...unless the investment strategy involves deploying some capital to an all in portfolio and some to a top 2 or top 3 sort...an idea advanced yesterday.

Thursday, April 18, 2013

T6 Long Term Delta Neutral...4.18.13

This post re-visits the weekly version of T6 with a slightly different portfolio mix....now including SH (the SPY inverse.) This new mix actually brings the total beta into negative territory, but, by following the momentum rankings we are able to mine the weekly positions for a much improved % return relative to the SPY alone.

Choosing a top 6 (all in) model (lower chart) yields a very impressive RSQ and low drawdown stats, but sacrifices total returns relative to a top 1 strategy.
One variation of using this model for capital deployment would be allocation of, for example, 50% of capital to a top 1 (or 2) sort and 50% of capital to a top 6 sort.  This kind of hybrid model would help insure drawdown loss while at the same time providing the opportunity for incremental market gains as the markets trend.
Actively managing the top 1 position portion of capital with the RSQ and P6 stops would also help insulate the portfolio from drawdowns. All the tools are right there.


Wednesday, April 17, 2013

T2 Default Update...4.17.13

The rankings are likely to change at the close based on today's downswoon.  Apple falls below $400, and the VIX is up 22% as the lunch hour ends.  It's been a wide ride for the VIX this week, up 28% on Monday, down 22% Tuesday and now up again to 17.04.
Earnings and associated guidance continue to drive the markets as bonds make incremental gains (note the TLT TrendX chart on the right. 

This may be a critical juncture....normally we would expect to see the bottom feeders jump in end of day to snap up perceived "bargains".  If we end on the lows of the day then we may suspect that more of same is to come.  Next overhead resistance on the VIX is 18.75.
The NYAD (NYSE advance/decline line) is currently at .22...bearish but not REALLY bearish.  Readings below .10 typically accompany bottom reversals, so short term traders should keep an eye on this number.

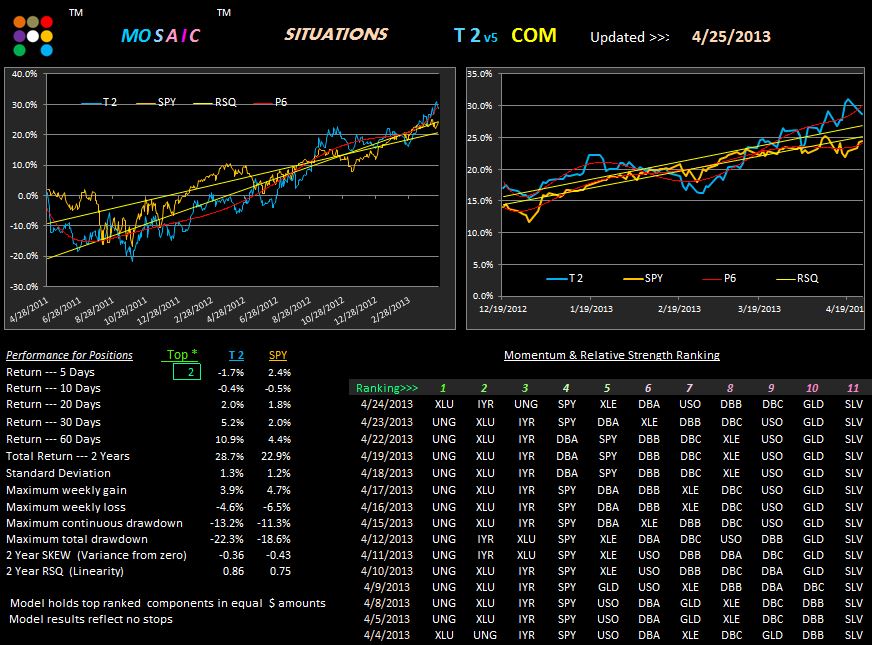
On the default T2 model we are seeing migration of TLT to #2 slot, while XLU (an historical safety net) is still showing strength.
Note that the equity line is below the P6 stop on both the 2 year and 6 month charts.
A time to be cautious with bullish positions.
Click on chart once to enlarge and clarify.

Tuesday, April 16, 2013

T2 Commodity Model...when will it end?...4.16.13

UNG (natural gas) will never go down....that's the likely conclusion a casual look at the momentum rankings might suggest.  The model has been knocking the socks off the the SPY benchmark although a quick check of the charts reveal a volatile ride along the way.
UNG remains in a solid upswing, currently holding at levels last seen in late November 2012.
The #2 slot held by XLU has also been a consistent winner and continues to gain traction as it approaches highs last seen in 2008.
On the dismal side...look at the continuing rankings of GLD and SLV.
Click once on chart to clarify and enlarge.

Monday, April 15, 2013

T2 Bonds & Fixed Income...4.15.13

China's reporting a bit of economic slowdown but Citigroup beats the street by a wide margin on increased trading revenues.  Gold and silver continue to get hammered..silver down 11%, gold down 8-9%...biggest one day losses in 2 years. XLE and the energies are also down more than 3% and  the usual  market gurus are uniformly predicting the cheapest summertime gas in years.

In early trading XLU was actually positive and XLV was holding until the pre noon (East coast time) selloff.
Volume is sub par...recall Friday's link on that subject...and the NYSE advance/decline line is .18...bearish but not anywhere capitulation stages.  April options expiration week is historically very bullish, especially the day after April 15th, so maybe this selloff  is just the usual market manipulation...or maybe not.

Our Bonds and Fixed Income portfolio...a safe haven from volatility that's delivered a 97% RSQ linearity over the past 2 years...still favors the dividend linked ETFs, but this is an all in sort ... all 11 ETFs) so the rotational momentum is really not a factor.
Click once on chart to expand and clarify.

Friday, April 12, 2013

T6 Bull Still Alive..4.12.12

Nothing seems to hurt this market.  North Korea, slumping PC sales, bad employment numbers, factory order slowdowns...so what?  It looked like today was going to be the bears' day to shine and gold got hit very hard indeed but the rest of the indices held up and recovered at the end of the day to leave the VIX at 12.06....not bearish.
XLU and XLV have been moving along in step...not the typical leaders for a bull market but that's the way the rankings roll.  More earnings reports and guidance next week may dampen the momentum, but for now no one seems to be worried. 
I have commented frequently about the low volume that has characterized the bull run up.  Here's one commentary that says low volume really means zilch in today's markets.

Thursday, April 11, 2013

Wall Street stocks on T2...4.10.13

As a companion to the Seeking Alpha model, early in 2013 I posted a portfolio of the top 10 stocks that various Wall Street gurus had predicted would lead the markets in growth and returns.
Since we haven't revisited that model for a while yesterday's pop to new all time highs in most of the indices seemed like an opportune time to do so.
This is a top 3 sort and you can play around with the various top # sorts at your leisure to explore other scenarios. Most of the sort look like good bets.
MSFT, which has been in the top 3 rankings for the past 9 days,and which had a big run up in the past couple days is hit with a 5% downswing today (HP is down 6%) on reports of dwindling PC sales ...everybody now wants handhelds. 
XRT (the retail sector ETF) is the runner today...up an amazing 2.25% in early going and sure to crowd into the #1 ranking of the X sector T2 model if momentum can be sustained.
Meanwhile....the markets are at another new high 90 minutes in on a rising NYSE advance/decline line.
If you have an difficulty seeing the T2 charts, clicking on the chart once should enlarge and clarify the image.

Wednesday, April 10, 2013

T2 Update..4.10.13

Nothing like a threatened missile launch by North Korea to set the markets on a bull run.
Volume has been running 50% par for Monday and Tuesday and today's numbers are just slightly improved so far. 
QQQ and XLF are showing strength and this may auger well for continued market momentum.  We are not seeing a fade down in today's action as of 3 hours in with the markets at new all time highs and the NYSE advance decline line approaching a new high for the day.

The default T2 portfolio is still showing TLT as # 1 ranked, which will obviously change tomorrow based on today's bond reversals. 
Note the TrendX chart of the TLT on the right side panel.  TLT has had a nice little run but the odds were clearly stacked against it on a technical basis and it was due for a fall.

Tuesday, April 9, 2013

T2 Seeking Alpha stocks still bullish, but...4.9.13

This is an update to the Seeking Alpha stock portfolio (stocks selected in January by the SA Team as offering the the greatest growth potential in 2013).  There have been a few bumps along the way (there always are) but the short term top 2 metrics look good. 
Current situation shows the 2 year P6 downslope and the 6 month P6 upslope and dead on the RSQ line however, so no consensus signal for confidence at this time.
Here's a closer look at the top 2 component charts showing the momentum surge in both issues.

Monday, April 8, 2013

FSC Tool...Chart Overlays...4.8.13

I've mentioned freestockcharts before and over the weekend I captured the various T2 study portfolios in FSC and saved in the USER REFERENCE section on this site for easy access.  I receive no kickback from FSC, I just think it's a great tool and provides a real time data feed  for most ETFs and stocks that have any decent volume.
One of the many things you can do with FSC is set up a multi-chart comparison of 6 issues in the time frame of your choice to see how momentum is moving between the portfolio components.

Here's a look at the T6 bullish portfolio on hourly bars showing how XLV and XLU have held up while other issues have faltered. SPY is shown as the shaded area...other ETFs are shown as line charts. 

The 10 period linear regression line applies to the SPY and is shown as a dotted purple line. The dotted white line is the VWAP of SPY....(volume weighted average price), a well known technical indicator useful for confirming price momentum.

What you don't get with FSC is any performance metrics so this is most useful as a visual aid in seeing how market dynamics are playing out.


Saturday, April 6, 2013

T6 Sample Portfolios

T6 Market Neutral Portfolio

T6 Beta Neutral Portfolio

T6 Beta Negative Portfolio

T6 Bullish Portfolio

These are sample portfolios used only for discussion purposes in the Newsletter and educational research.
Relative positions of these instruments within the T6 software do not constitute a recommendation or solicitation to either buy or sell any or all of these issues at any time.

Friday, April 5, 2013

Changes Ahead?...4.5.13

With the NYAD (NYSE advance/decline line) opening at .08 today (REALLY LOW)...experienced gap traders knew this was a no-brainer and went LONG SPY and other correlated equities.  For those that like to sleep in or don't care about short term volatility in the markets today's drop was a stark reminder that a market neutral type approach can help ease the pain.

The VIX hit 15.6 in early trading today, the highest its been since March 4th and, as forecast earlier in the week, TLT is on a momentum run, rising over 5 points in the last 5 sessions and up 2.25% on the day.

Here's a look at a market neutral T6 weekly model with a balanced beta (a sum of zero of the component betas = a perfect market  neutral model...but beta values do change over time...so today's net beta value is -.14)(Just in case you were going to ask).

This is a top 2 sort, but you can run through a top 1, 3, 4 sort etc, at your leisure if there's any interest.  The last date is April 1 and that is because this is a weekly model that updates on Monday's close.
The portfolio shot is from http://www.freestockcharts.com/ and yes...it is free.
 
Note the volatility of SPY versus the other 5 components. 

Thursday, April 4, 2013

T2 ALL IN Bond/FI...4.4.13

Questions continue regarding a REALLY low maintenance portfolio that will at least get close to SPY returns without the volatility. This is one solution using the previously posted Bond and FI (fixed income) model.  This is not a recommendation to invest in these ETFs, just showing as what's possible without precise cherry picking of the components.
In this case we've made DVY ( our recent #1 ranker) as our benchmark and then created and all in model by simply selecting top 11
What's attractive about this sort is that linearity (RSQ) of the model is .97 (the higher the number the closer to a straight line) and while the shorter term metrics of the top 11 sort do lag DVY (DOW dividend yield ETF) it's the drawdown numbers that stand out (a SKEW of 0 would mean no volatility.
If you run this model yourself you will note that of the 10 6 month component charts only 4 have upslope RSQ lines....which makes the shorter term returns even more surprising.

Below the T2 chart is the present trend of the SPY TrendX (live on the right side panel)...which is arguing for a continued bull market...until proven otherwise by a break in the yellow trendline. 

Wednesday, April 3, 2013

T2 Seeking Alpha Update..4.3.13

It's been 7 trading days since the last check on the Seeking Alpha stock based model, so here's the current state of affairs using a top 2 sort.
JNJ, WMT and KO continue to dominant the top 3 slots but both KO and WMT look overextended at the moment and the leader board may be about to change.
The SA model has performed well over most time frames although somewhat lagging on the 60 day.

On the 6 month chart the equity line has just crossed above the RSQ stop line and the P6 is upslope, so from a technical perspective the model is in a "risk on" mode (vested).  Today's market deterioration may result in at least a short term change in momentum however so caution is advised at this juncture. 

On the 2 year chart the equity line is above the RSQ but P6 is down slope..a situation that has not occurred since 7/5/11 to 10/5/11...which is another caution to scale back on positions and wait for a more opportune investment scenario.

Tuesday, April 2, 2013

T6 bull model Update..4.2.13

Today's surge overrules yesterday's early doom scenario and utilities and health care (XLU, XLV) are the current leaders both in the markets and in our T 6 bullish model. Volume was actually quite low yesterday and that theme continues today as the SPY approaches an all time high.

The last 2 weeks have been a market of selective sector gains with tech and financials (QQQ & XLF) lagging in returns.

If the bull market is really going to take off that lag needs to become a lead, coupled with a continued low VIX ( less than 13).  Just something to keep an eye on.  The 11 component T2 default model, which includes a wider spectrum of sectors and volatility may also be helpful in tracking the QQQ&XLF momentum... which we will examine tomorrow.

Monday, April 1, 2013

Bonds & FI Update.. 4.1.13

Checking in on the Bonds and Fixed Income related  T2 model with a top 2 sort reveals the continued strength of the dividend based DVY and SDY issues...even more so than the SPY itself.
Meanwhile, TLT is slowly migrating to the green rankings.  Whether this is a harbinger of things to come remains to be seen, but if history is any gauge TLT may see more momentum to the upside.

Meanwhile, following last week's comments on UNG (natural gas) within the context of the T2 Commodity model here are two links providing a caution and a deeper analysis.