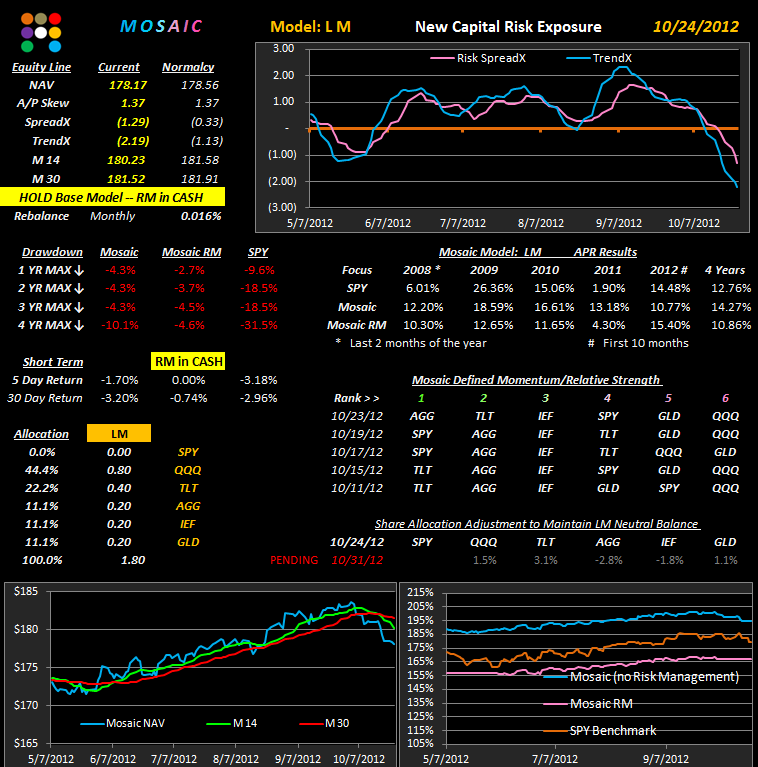
Here are the weekly updates for the fixed allocation models. The RM versions for both models remain in cash since Oct 5th, accounting for their 0 % returns short range. In both models the RM version is currently outpacing the active Mosaic models and in the case of the LM model the RM version is actually ahead of SPY by 1% for the year.The cross of the M14 and M30 did a great job of forecasting further declines and we're looking for a new cross up before the RM versions take positions.
Today is our designated rebalance day for the month. Using the Rebalance Calculator emailed to subscribers last month just enter today's prices and your test model account value to calculate the correct position sizing for each ETF.
The momentum rankings are very bearish currently...SH is the inverse of SPY...which is as bearish as out model will allow. This could all change quickly if the typical end of month buying kicks in, but as of this post (8:00 AM PST) the markets are in a slow grind down with Apple losing over 2 %. Gold is strong and holding...usually a bad sign for the equity markets. Volume is paper thin so expect higher volatility than normal and reduced reliability of the technicals.
Wednesday, October 31, 2012
Tuesday, October 30, 2012
T 9..An Aside...10.30.12
Just for fun here's a rotation model using 9 ETFs and it rotates into the top 7 on each Monday. The model is based on weekly bars and what's attractive in this version is the total drawdown numbers...almost too good to be true...max continuous drawdown = 3.9% !!!.
T9 only returns 25% over the past 4 years, basically equal to SPY but it been a whole different investment experience than holding the volatile SPY.
These models are vest suited for IRAs and other capital appreciation accounts where risk management is a primary concern...still...the returns are about 10X better than the average CD.
To save you some time figuring it out, I've culled XLE and IWM from the T3 mix to come up with the T9 components.
Although both XLE and IWM have had extended runs in the top 3 slots at T3, that comes with a price...volatility... that can turn into a double edge sword when the markets get bearish or when news drives XLE wildly up or down. The T9 portfolio just calms things down a bit.
T9 only returns 25% over the past 4 years, basically equal to SPY but it been a whole different investment experience than holding the volatile SPY.
These models are vest suited for IRAs and other capital appreciation accounts where risk management is a primary concern...still...the returns are about 10X better than the average CD.
To save you some time figuring it out, I've culled XLE and IWM from the T3 mix to come up with the T9 components.
Although both XLE and IWM have had extended runs in the top 3 slots at T3, that comes with a price...volatility... that can turn into a double edge sword when the markets get bearish or when news drives XLE wildly up or down. The T9 portfolio just calms things down a bit.
Monday, October 29, 2012
TLT / XLF Pair Trade - Part III
This is the XLF / TLT pair trade displayed in Market Rewind metrics. Those of you who have subscriptions to Market Rewind Pro can tweak the model parameters but this version is about as good as it gets. This program only looks back 6 months whereas our TradeStation models examine a 16 month rolling lookback period. But here's some confidence building news.. the same settings work in either time frame. What's important to note is that these trades have a definite duration...in this case 5 days. The impressive results are based on that excursion length and virtually all failed trades can be traced to holding positions too long.
For the technically oriented-----All these pair trades are based on the the z-score, a log ratio examination of the relationship between the current standard deviations of the pair components. One of the criteria that makes an ideal pair trade is when the thresholds of the z-score reversals are clearly defined. Using a topographic analysis of all the trades over the past 6 months shows that this is clearly the case with the TLT/XLF trades. In fact, if you apply this type of analysis to most the popular pair trades only a very few will show this type of isolated "sweet spot".
Saturday, October 27, 2012
T 3 Update +T2..10.27.12
T3 is now firmly in the bond camp with all 3 top slots in bonds and XLU (Spyder Utilities), a favorite hedging ETF, in slot #4. This is the first time we have seen this alignment in the 2 year T3 momentum study and it should definitely be a cause for some concern for Long equity positions.
Technically, the markets are substantially oversold but nothing says they can't get a lot more oversold before a rally kicks in. In any attempt of pick a bottom the I've always found it better to wait for the hairy bottom set up pattern (that is , actually see a bottoming pattern develop) and then ride the rally up.
The RM models remain in cash and that where I'm sitting for the time being.
The T3 signals have been a little late in detecting relative strength in the various components lately, which has cost the model a few percentage points.
To resolve this problem and improve odds I've sped up the momentum algorithm a bit, kicked XLP from the mix and added FXE (the Euro). This new model is shown below as T2 because it only takes positions in the top 2 ranked ETFs and if either of them fall out of rank during the week then those positions are closed.
In the near future I'll make the T2 software package available to subscribers only for a modest one time fee.
You will be able to build your own portfolio of 1 to 11 ETFs and then set the momentum rankings to focus on the top # of ETFs of your choosing. The program has an end of day data feed built in.
Alerts will not be included in the program as those are calculated on TradeStation and imported into the Mosaic platform within a different time frame.
We'll flush out more details on T2 later in the week as the final version gets set to go. I'll also post a few examples of what you can do with this platform to create a blend of portfolios to further insulate your risk.
Technically, the markets are substantially oversold but nothing says they can't get a lot more oversold before a rally kicks in. In any attempt of pick a bottom the I've always found it better to wait for the hairy bottom set up pattern (that is , actually see a bottoming pattern develop) and then ride the rally up.
The RM models remain in cash and that where I'm sitting for the time being.
The T3 signals have been a little late in detecting relative strength in the various components lately, which has cost the model a few percentage points.
To resolve this problem and improve odds I've sped up the momentum algorithm a bit, kicked XLP from the mix and added FXE (the Euro). This new model is shown below as T2 because it only takes positions in the top 2 ranked ETFs and if either of them fall out of rank during the week then those positions are closed.
In the near future I'll make the T2 software package available to subscribers only for a modest one time fee.
You will be able to build your own portfolio of 1 to 11 ETFs and then set the momentum rankings to focus on the top # of ETFs of your choosing. The program has an end of day data feed built in.
Alerts will not be included in the program as those are calculated on TradeStation and imported into the Mosaic platform within a different time frame.
We'll flush out more details on T2 later in the week as the final version gets set to go. I'll also post a few examples of what you can do with this platform to create a blend of portfolios to further insulate your risk.
Friday, October 26, 2012
T 3 Update ..10.26.12
We're basically in a holding pattern at this point waiting for ?. Apple was the big unknown until last night and with that bullet apparently dodged the election appears to be the next impending market catalyst, although the effect is likely to be on select sectors only....such as health care and financials.
Based on the today's early gains in both bonds and equities it will be interesting to see how the momentum rankings unfold for Saturday's update, which will include the new T2 model.
There are no new alerts this morning and ...being Friday... the closing bais is to the downside for equities.
The TLT/XLF pair trade is currently in cash with no new signal this morning.
Based on the today's early gains in both bonds and equities it will be interesting to see how the momentum rankings unfold for Saturday's update, which will include the new T2 model.
There are no new alerts this morning and ...being Friday... the closing bais is to the downside for equities.
The TLT/XLF pair trade is currently in cash with no new signal this morning.
Thursday, October 25, 2012
T 3 Update.. 10.25.12
T3 is managing to keep pace with the SPY drawdown, but it's failure to shine a little better is a cause for ongoing ways to increase net returns. As daily volatility increases the momentum algorithm may have to be speeded up to reflect this reflect this volatility and prevent the whipsaws that will otherwise negatively impact our equity curve.
I mentioned this the other day but note the break of the SPY TrendX in the right hand panel (this is running in real time). Today's dramatic reversal of the NYAD from an opening value of 6.35 to the current level of .98 is a classic "pop and drop" gap failure...typically with bearish implications.
Given the rising instability in the markets I'm following the lead of the Mosaic RM models and adopting a 75% cash position with the Situations until structural alignments in the markets (equities vs. bonds) regain a balance. This means closing the my Situations position from 10.12.12 (TLT, XLU,AGG) this morning at 8:30 AM.
For shorter term situations the current DB, GS2 and MRSI signals are distinctly negative and since our stated policy is not to publish short signals any new Long Alerts have been absent for the past week.
This weekend I hope to present a new T2 model with risk control stops to help avoid the recent drawdowns we've experienced recently. It's still a work in progress, but that's the goal.
I mentioned this the other day but note the break of the SPY TrendX in the right hand panel (this is running in real time). Today's dramatic reversal of the NYAD from an opening value of 6.35 to the current level of .98 is a classic "pop and drop" gap failure...typically with bearish implications.
Given the rising instability in the markets I'm following the lead of the Mosaic RM models and adopting a 75% cash position with the Situations until structural alignments in the markets (equities vs. bonds) regain a balance. This means closing the my Situations position from 10.12.12 (TLT, XLU,AGG) this morning at 8:30 AM.
For shorter term situations the current DB, GS2 and MRSI signals are distinctly negative and since our stated policy is not to publish short signals any new Long Alerts have been absent for the past week.
This weekend I hope to present a new T2 model with risk control stops to help avoid the recent drawdowns we've experienced recently. It's still a work in progress, but that's the goal.
Wednesday, October 24, 2012
TAQK and LM Updates...10.24/12
As expected, the correction is cutting into our previous gains in both models. The LM model equity line has moved back to mid August levels, while the TAQK model equity line has moved back to mid July levels.
The current winner is the RM version of the LM model, which went to cash on 10.5.12, the same day the TAQK RM version went to cash.
The present momentum rankings are all skewed to bonds and SH (the SPY inverse) as the markets do a little "pop and drop" at today's open. For now cash is looking like a smart position until we see whether this is just a "correction" or the beginning of a major slide...which will experience periodic rallies of hope (and market manipulation) along the way down.
The XLF/TLT pairs trade (both sides) was exited at yesterday's close and we'll look at the results of that trade on Monday when we continue a more thorough study of the pair dynamics. This turned out to be an abbreviated trade, only 4 days, whereas our expected excursion was 5 days but you take what you can get in this game and the exit signal turned out to be precocious in light of today's TLT retreat.
I'm working on a small portfolio of high probability pair trades that I hope to include in future daily Newsletter posts. If the markets do start a slide then these short term boutique type trades are one place to nickel and dime up the equity line with minimal risk exposure.
The current winner is the RM version of the LM model, which went to cash on 10.5.12, the same day the TAQK RM version went to cash.
The present momentum rankings are all skewed to bonds and SH (the SPY inverse) as the markets do a little "pop and drop" at today's open. For now cash is looking like a smart position until we see whether this is just a "correction" or the beginning of a major slide...which will experience periodic rallies of hope (and market manipulation) along the way down.
The XLF/TLT pairs trade (both sides) was exited at yesterday's close and we'll look at the results of that trade on Monday when we continue a more thorough study of the pair dynamics. This turned out to be an abbreviated trade, only 4 days, whereas our expected excursion was 5 days but you take what you can get in this game and the exit signal turned out to be precocious in light of today's TLT retreat.
I'm working on a small portfolio of high probability pair trades that I hope to include in future daily Newsletter posts. If the markets do start a slide then these short term boutique type trades are one place to nickel and dime up the equity line with minimal risk exposure.
Subscribe to:
Posts (Atom)