This is important!. The markets are fickle. Murphy's Law is alive and well in the NYSE and NASDAQ and those who've been in the trading trenches for a more than a few years know all about the unexpected curve balls and spit balls the market can pitch us. Trying to catch many of those pitches is iffy...trying to read them for a base hit is even harder.
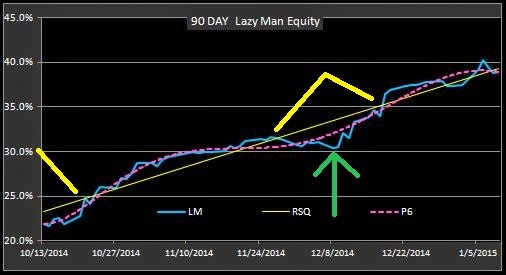
I've spoken of "paradigm shifts" in the markets before and here's a little study of the Lazy Man (LM) model illustrating the repetitive and fractal nature of those shifts. The LM of course is just like putting on a set of special goggles to examine market dynamics. M3 looks at the markets differently than LM and there are thousands upon thousands of other technical goggles or templates that are available to perform alternate views. What's important is recognizing periods when the markets are not "in focus" with the technical goggles we are using and being ready to act when that focus returns.
I'm not going to spend pages digressing about why the markets behave this way...suffice to say, after watching and trading them for almost 30 years, they do.
Below are a 90 day and 2 year chart of LM. The paradigm shifts are defined by the yellow calipers and the beginning of the re-focus is indicated by the green arrows (and the upslope behavior of P6.
Alternate templates would likely reveal alternate paradigm shifts.....but being alert to when the markets are behaving out of sync with our analysis format (or another) can avoid unnecessary drawdowns and headaches by engaging simply money management practices such as scaling back positions or simply standing back in cash.
Sunday, January 11, 2015
Thursday, January 8, 2015
Follow Through...01.08.15
The markets continue to run up and have now gone from oversold to almost overbought in 2 days, Keep in mind the caveat of Friday's negative bias as we look for a tradable trend.
Here's a look at SPY, XIV and VXX on 90 day charts and we can see that XIV has really failed to perform in the Beta+ manner we have witnessed in the past. This lack of SPY/XIV correlation tends to create suspicion about any new XIV longs until that correlation is re=established.
Also note below a new free access tab that will be added to the Mosaic M3 site....the 7 AM BUZZ, a quick snapshot of M3 component dynamics and the NYAD as of 7 AM PST each day....just a little thumbnail reference to set the pace for the upcoming day's action.
Here's a look at SPY, XIV and VXX on 90 day charts and we can see that XIV has really failed to perform in the Beta+ manner we have witnessed in the past. This lack of SPY/XIV correlation tends to create suspicion about any new XIV longs until that correlation is re=established.
Also note below a new free access tab that will be added to the Mosaic M3 site....the 7 AM BUZZ, a quick snapshot of M3 component dynamics and the NYAD as of 7 AM PST each day....just a little thumbnail reference to set the pace for the upcoming day's action.
Wednesday, January 7, 2015
Tentative Bounce....01 07.15
We got the bounce suspected at yesterday;s close on the M3 site and are now looking for confirmation of a possible new bullish trend. Recent lows do tend to get revisited so we are now in cash to avoid that potential trap door (see below). Volume was not confirming today.
For non-M3 subscribers here's a link to the new Mosaic format (Monday's post) and an update sample.
M3 rates are going up to $50/ month as of Jan 15th,
NAAIM members will be able to subscribe at the current $30/month rate.
For non-M3 subscribers here's a link to the new Mosaic format (Monday's post) and an update sample.
M3 rates are going up to $50/ month as of Jan 15th,
NAAIM members will be able to subscribe at the current $30/month rate.
Tuesday, January 6, 2015
Ponzo Update....1.06.15
In response to a number of requests here's the latest Ponzo Time Machine odds for the next 6 months.
The forecast has actually become a bit more neutral than our previously downside skewed view.
Monday, January 5, 2015
From Bad to Worse....1.05.15
So much for Friday's bullish close. The VIXEN's jaws opened wide today (see below) and XIV dropped over 7%...once again resolving to the downside.
Per the TrendX on the right side panel the potential for further downside is looming and the bearish version of the Ponzo Time Machine could be upon us for a bit.
We have a new version of M3 for 2015 as a result of 10 hours of work this weekend with a friend's programming assistance to backtest various risk parameters. M3 is now substantially improved from a risk standpoint (total 6 month drawdown cut to less than 7%) and I'll post today's M3 update on Wednesday on the M3 site.
We'll also take a look at "paradigm shift" later this week... a concept I've mentioned often and which is critical in assessing forward looking risk.
Per the TrendX on the right side panel the potential for further downside is looming and the bearish version of the Ponzo Time Machine could be upon us for a bit.
We have a new version of M3 for 2015 as a result of 10 hours of work this weekend with a friend's programming assistance to backtest various risk parameters. M3 is now substantially improved from a risk standpoint (total 6 month drawdown cut to less than 7%) and I'll post today's M3 update on Wednesday on the M3 site.
We'll also take a look at "paradigm shift" later this week... a concept I've mentioned often and which is critical in assessing forward looking risk.
Sunday, January 4, 2015
Volatility Skew Continues to Frustrate....1.04.15
While the markets try to stabilize and find at least a short term trend volatility continues to be a wild card, defying both fundamental and technical indicators. Here's a look at the beta spectrum using FreeStockCharts (FSC), including several outlier volatility issues that we normally don't examine but their inclusion helps to formulate something of a group consensus.
For those unfamiliar with FSC the most bullish column is Xu2 avg, which means price is crossing up thru the 2 day moving average. Abv2 avg means price is above 2 moving average, etc. Xd2 avg means crossing down thru the 2 day movng average.
Now what's weird here is that the 2 most bullish short term signals are SH and XIV, while the most bearish longer term (7 day) issues are SPY, SSO and XIV...for which we would expect a positive correlation.
What's the bottom line?. Well, for risk adverse old timers like myself it means scaling back any new positions in M3 until the signals get in sync, as mentioned in the Friday M3 post. This little study is just a confirmation that, for whatever reasons, volatility trends are not clear at the present time.
BTW, Friday's closing action was bullish for Monday, per the SPY VIXEN below..
For those unfamiliar with FSC the most bullish column is Xu2 avg, which means price is crossing up thru the 2 day moving average. Abv2 avg means price is above 2 moving average, etc. Xd2 avg means crossing down thru the 2 day movng average.
Now what's weird here is that the 2 most bullish short term signals are SH and XIV, while the most bearish longer term (7 day) issues are SPY, SSO and XIV...for which we would expect a positive correlation.
What's the bottom line?. Well, for risk adverse old timers like myself it means scaling back any new positions in M3 until the signals get in sync, as mentioned in the Friday M3 post. This little study is just a confirmation that, for whatever reasons, volatility trends are not clear at the present time.
BTW, Friday's closing action was bullish for Monday, per the SPY VIXEN below..
Thursday, January 1, 2015
Last Day of the Year Tumble....12.31.14
The Santa Claus rally pooped out of the last day of the year with selling accelerating into the close and the VIX up over 20%. Going forward into 2015 there's a number of issues that may catalyze the market momentum and we'll look at a few of those in the coming week.
For now the historical record favors a bullish move on Friday, the first trading day of the new year and we have somewhat divergent signals between our M3 and LM models....VXX vs cash,,, so tomorrow's open will hopefully provide a better idea of how that will resolve.
The SPY TrendX is bearish and both model dashboards are bearish.....we just have to prepared for whatever the markets deliver and the new simple fixed limit stops on both models should help protect incremental capital appreciation.
For now the historical record favors a bullish move on Friday, the first trading day of the new year and we have somewhat divergent signals between our M3 and LM models....VXX vs cash,,, so tomorrow's open will hopefully provide a better idea of how that will resolve.
The SPY TrendX is bearish and both model dashboards are bearish.....we just have to prepared for whatever the markets deliver and the new simple fixed limit stops on both models should help protect incremental capital appreciation.
Subscribe to:
Posts (Atom)