Monday, October 19, 2015

Ponzo Credit Spread....10.19.15

Here's a few more details on the upcoming Ponzo credit spread strategy.
First we check the Monday night weekly update of the SPY Ponzo chart to assess the likely risk profile over the coming 8 weeks, although our attention is really focused on the upcoming 3-4 weeks.
What we're looking for is a consensus signal either up, down or neutral.  The stronger the consensus..whether up down or neutral. the better.
Then we set up or down 1 to 2 standard deviations and set a spread bracket.  If the trend is down then we sell puts, if the trend is up or neutral then we sell calls...for now these are always credit spreads.
We look for option expiration in 14 to 21 days as this is the period of maximum premium decay and this shortened duration also limits our exposure time.
The example shown below is just that...an example. We can a lot better than this risk/reward trade in actual market conditions
With tomorrow's update of the weekly Ponzo forecast we'll explore a couple potential spread setups using this strategy..

Saturday, October 17, 2015

VDX Updates> SPY,XLU, FXI....10.17.15

This weekend's update of the VDX charts illustrates the market's overbought character, especially in the case of utilities, which we normally expect to be under performing a rising SPY. We are at a significant resistance level both nationally and internationally but the markets appear inclined to buy weakness in spite of less than stellar earnings by the mainstream.
I had a chance to conference call with the chief strategists for 2 of the largest investment banks and their prognosis to the end of the year was (1) neutral and (2) bullish with SPY around 220.
We are about to begin the 5 historically strongest months of the year (November - March) but that didn't turn out well in 08-09 so we don't want to bet the farm quite yet.
Earnings and fear of the FED continue to cause volatility ripples but the VIX is now down to the 16s so the trend is up until proven otherwise.
Next week should be instructive if we break through the current upper resistance levels.
Note the SPY's current status in the TrendX chart in the right side panel.


Thursday, October 15, 2015

New Short Term SPY/GSPC Ponzo Charts....10.15.15

These are brand new Ponzo charts of the SPY and GSPC (S&P500 ETF and Index) that look forward 8 weeks as opposed to the standard models that look forward 18 weeks.  The thinking here is that the odds of predicting what's going to happen in the next 8 weeks is considerably better than predicting what the markets are going to do 18 weeks out. And we use both the S&P ETF and Index to check for signal confirmation. Note the extremely low error factor on the Best Historical Fit insert chart.
Compare these charts with the results of the longer term (18 week) SPY and GSPC charts posted yesterday and Tuesday.
SO what do we do with these new Ponzo charts?
This is where it gets interesting.
We're going to be starting a new service using SPY weekly options to create short term credit spreads  (2-3 weeks) and over the next week or so I'll explain some of the nuances of this defined risk strategy to complement the M3 suite of models.


Wednesday, October 14, 2015

GSPC (S&P) and QQQ Ponzo Charrts...10.14.15

Per reader requests here are the GSPC (50 year S&P) and QQQ (25 year) Ponzo charts. The idea was that perhaps the GSPC which looks back 50 years might have a different forecast than the SPY ETF which only looks back 25 years (posted yesterday).  Turns out they are pretty much in sync although the GSPC does offer some glimmer of hope at year's end.  The QQQ chart in contrast is almost bullish although this weekend's Barrons magazine featured several articles that were less optimism for tech, especially PC sales.  Keep in mind QQQ is 20% APPLE, which tends to skew the attributes of the other 99 components.

Tuesday, October 13, 2015

SPY Ponzo Update..10.13.15

This week's update of the Ponzo forecast continues the negative theme for SPY for the coming months.  Keep in mind the model looks at the current 25 week price action and then looks at the past 25 years SPY price patters to find those scenarios that best match the current action and show what happened in the subsequent 18 weeks.
The short term ( 14 day) best historical fit line has been eerily correct for the past 3 months even in the face of multiple macro and micro economic factors driving the markets.
If you believe that  history tends to repeat itself then using the Mosaic version of the Ponzo model may help you navigate the upcoming risk environment.  Readers query on how to apply the forecast range and suggestions include selling appropriate ITM covered calls and selling call credit spreads at the outlier upper band strikes if you're bearish or selling put credit spreads at the lower outlier bands if you're bullish.
Using the Ponzo forecast and the VDX charts as a short term trend/momentum confirmation can be very effective.

Monday, October 12, 2015

VDX Updates...10.12.15

With earnings season in full swing the markets are in overbought territory and ripe for a pullback on any bad news from the large caps and/or big tech.  China, in the form of FXI, is also overbought although there's been a slew of recent articles in Barrons, WSJ and various hedge fund newsletters touting the bullish prospects for China and the apparent bottoming currently underway.  Meanwhile. analysts are also predicting Alibaba (BABA), the darling of IPO speculators last year, could fall another 50%.
Now just put those 2 forecasts together and you will definitely be confused.


Saturday, October 10, 2015

Trading the Paradigm Shifts (Part 1)...10.10.15

The markets move in fractal cycles (multiple time frames) that are neither linear nor easily discerned. As a result, all market models typically experience periods when they perform "in paradigm, or in sync with market dynamics or "out of paradigm" when the models do not perform in sync with market dynamics. Being aware of when the models we are tracking are in or out of paradigm is therefore crucial to maximizing our returns.
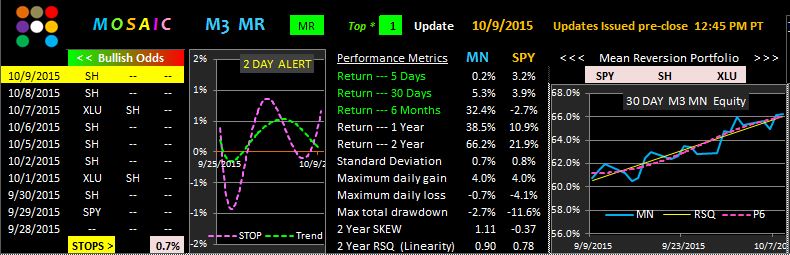
In the case of  Mosaic M3 we track 3 distinct paradigms  >>
MR, a mean reversion model, which basically buys the 3 day low.
MN, a momentum model, which basically buys the 3 day high.
SS, a market neutral model, which uses SPY leveraged ETNs to capture above average volatility.
I say "basically" for MR and MN because there are embedded algorithms in each model that filter for linearity and correlation of the ranking calculations. In times of extreme volatility the models will retreat to cash.
Given the inherent drivers for MN and MR we would expect MN, the momentum based model, to do well in strongly trending markets, whereas MR will perform better in a stepping type of market environment or in a consolidation market.
We can detect the current paradigm (and focus our capital accordingly) by examining the performance metrics and the equity curves of each model.
In the versions of MN and MR shown the returns are based on the top 1 ranked positions.
On the daily updates we use a version of MN using the top 2 ranked inputs as our goal is to minimize
portfolio flux and help identify when changes in paradigm are most likely.
Based on a cursory exam of the 2 equity curves we are currently in a trending market.  This is confirmed by the MR model which indicates extreme weakness in SH (SPY inverse) and no ranking for XLU, whose appearance in the rankings should provide an early warning for a pending paradigm shift.