The markets put on another bullish day although momentum was muted and volume was thin. Friday will be the last trading day of the month (75% Bullish) and the apparent delay in a US military response to the Syrian situation (and the possible consequences) gave a positive slant to the news.
GLD and SLV did go red today, a possible first step in a larger trend reversal so positions the the Hybrid model should be closely monitored and perhaps portions of any positions closed in order to protect recent gains.
Over in the default model the P6 is starting to look optimistic but a confirmation from the TrendX and the short term metrics would present a better case for a vested position in that model.
Friday's action is expected by characterized by more light volume and increased volatility ahead of the 3 day weekend.
Thursday, August 29, 2013
Wednesday, August 28, 2013
Advance/Decline Line is the Key...8.28.13
Here's a look at the current NYAD (NYSE advance/decline line) that I've mentioned many times before. It really is key in understanding underlying market momentum and, of course, it can rise like a rocket or plummet like a stone based on news or rumors.
Yesterday's NYAD was just plain dismal and the surprising thing is that it only dropped to the .20 levels. Real selling is characterized by readings below .10 and such events occur on about 1% of trading days.
After 2 hours in today we're seeing an attempt at a rally, although volume remains low as everyone waits to see what the other guy is going to do.
Note what may be a current topping in the NYAD chart. Although the argument can be made that selling days such as yesterday are really buying opportunities a similar argument can be made that yesterdays' lows will be tested again before a short term bottom is put in place...recall the "hairy bottom" pattern previously discussed.
In our Hybrid model silver is showing some weakness while gold continues to run.
Yesterday's NYAD was just plain dismal and the surprising thing is that it only dropped to the .20 levels. Real selling is characterized by readings below .10 and such events occur on about 1% of trading days.
After 2 hours in today we're seeing an attempt at a rally, although volume remains low as everyone waits to see what the other guy is going to do.
Note what may be a current topping in the NYAD chart. Although the argument can be made that selling days such as yesterday are really buying opportunities a similar argument can be made that yesterdays' lows will be tested again before a short term bottom is put in place...recall the "hairy bottom" pattern previously discussed.
In our Hybrid model silver is showing some weakness while gold continues to run.
Tuesday, August 27, 2013
P6 and TrendX are Negative...8.27.13
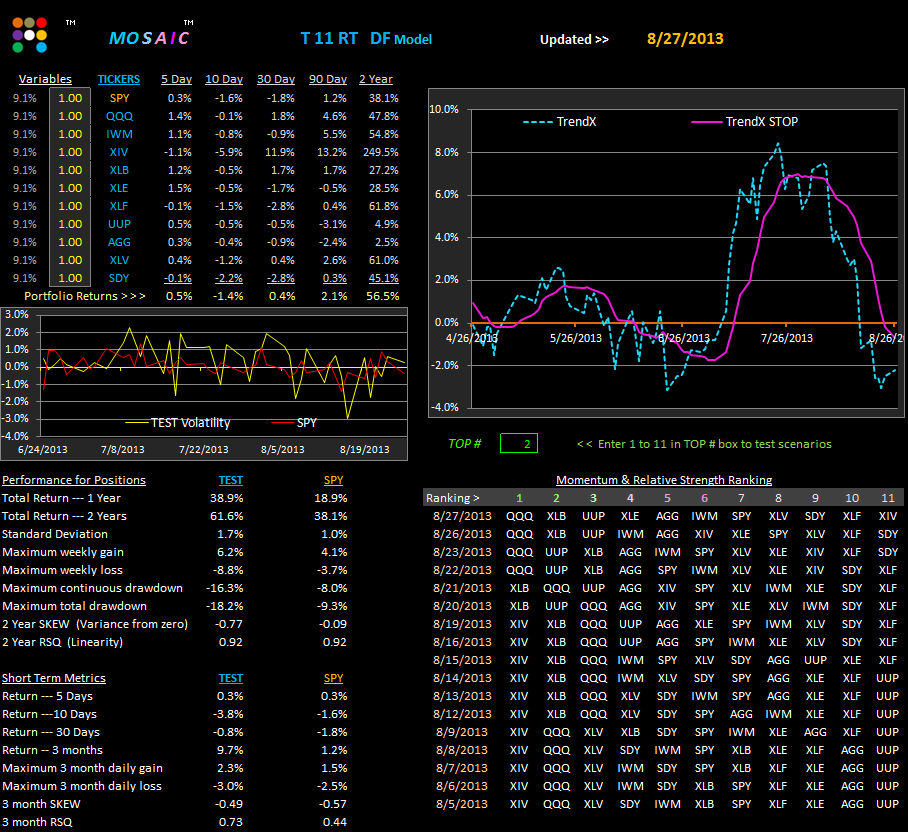
Here's a real time ...pst 9:00 am...check on our default model with XIV sitting in for XLU. XIV is the VIX inverse so if markets are bullish XIV is high whereas if markets are bearish XIV is low.
Note XIV's current position at #11.
I'm using the new format again featuring the model TrendX and we should clearly be in a CASH mode to avoid the market drawdown that's currently underway. How far this "correction" will go remains to be seen.
By the way...several market gurus announced today that a new bull market in gold is about to start.
Note XIV's current position at #11.
I'm using the new format again featuring the model TrendX and we should clearly be in a CASH mode to avoid the market drawdown that's currently underway. How far this "correction" will go remains to be seen.
By the way...several market gurus announced today that a new bull market in gold is about to start.
Monday, August 26, 2013
Hybrid Model Rolls On...8.26.13
I've mentioned before that the Hybrid model leadership of silver and gold was in danger of collapse following its recent parabolic rise. In early going today those issues did in fact turn negative but late day selling in equities apparently drove money into those issues and they once again reached short term highs.
The Hybrid model has made some very impressive gains over the past 90 days and 30 days relative to SPY, but the TrendX of a top 2 sort indicates that overhead resistance has now been penetrated and odds favor a near term retracement...... so keeping the exit door close at hand is advised.
The chart shown in from the beta version of the new real time T11 platform, which includes not only a real time feed (no data fees), but both a TrendX and a Volatility Skew indicator to help gauge when positions should be vested and when cash is the more appropriate risk management strategy.
Note that the standard commodities model is also performing very well, while the default and X sector models basically tread water and continue to display down slope P6 signals.
The Hybrid model has made some very impressive gains over the past 90 days and 30 days relative to SPY, but the TrendX of a top 2 sort indicates that overhead resistance has now been penetrated and odds favor a near term retracement...... so keeping the exit door close at hand is advised.
The chart shown in from the beta version of the new real time T11 platform, which includes not only a real time feed (no data fees), but both a TrendX and a Volatility Skew indicator to help gauge when positions should be vested and when cash is the more appropriate risk management strategy.
Note that the standard commodities model is also performing very well, while the default and X sector models basically tread water and continue to display down slope P6 signals.
Friday, August 23, 2013
Top 2 View of T6 Hybrid Model..8.23.13
Despite, or perhaps because of the NASDAQ blackout on Thursday, the equity markets managed to make some modest gains yesterday. Fears of another possible flash crash kept a lot of money on the sidelines and volume was trickling most of the day, with a gradual fade down into the close.
This is not a market characterized by a lot of enthusiasm, either up or down and the next earnings season will most likely be the catalyst for the next big move although the typical end of month buying may provide some lift.
In the meantime the commodities continue to book solid gains, as evidenced by the leadership of XLB (basic materials) in the T6 Hybrid model. If the overall market was participating in this otherwise sector rally the positions of VIX and SPY would take top slots. This is currently not the case although the relative weakness of XLU (utilities) in the momentum rankings indicate that risk hedging is not a big concern...so once again we are left with a market malaise looking for a reason to move.
The top 2 sort of the Hybrid model posted earlier this week continues to display a downslope P6, thus arguing for the safety of cash. This sort, although still producing twice the volatility of the benchmark SPY, is probably the better (safer) choice than the top 1 sort posted earlier.... although strict adherence to the money management stops is crucial in both models.
This is not a market characterized by a lot of enthusiasm, either up or down and the next earnings season will most likely be the catalyst for the next big move although the typical end of month buying may provide some lift.
In the meantime the commodities continue to book solid gains, as evidenced by the leadership of XLB (basic materials) in the T6 Hybrid model. If the overall market was participating in this otherwise sector rally the positions of VIX and SPY would take top slots. This is currently not the case although the relative weakness of XLU (utilities) in the momentum rankings indicate that risk hedging is not a big concern...so once again we are left with a market malaise looking for a reason to move.
The top 2 sort of the Hybrid model posted earlier this week continues to display a downslope P6, thus arguing for the safety of cash. This sort, although still producing twice the volatility of the benchmark SPY, is probably the better (safer) choice than the top 1 sort posted earlier.... although strict adherence to the money management stops is crucial in both models.
Wednesday, August 21, 2013
Another View of XIV...8.21.13
Midday it looked like the markets were going to follow through on yesterday's modest rally....and then the trap door opened and the markets came tumbling down into the close. Of particular note...most of the closing imbalance order were on the SELL side...that means market makers were struggling to find buyers for their SELL positions and were trading on the BID, not the ASK prices.
The volatility can probably traced to the FED and the uncertainty of the equity damage a pullback in quantitative easing would create. No one wants to be long through another 2008-2009 collapse.
Since you asked...thanks to Jim L. for the suggestions on XIV variations. Here's what happens when we add XIV (the VIX inverse) to the T11 hybrid model and pull UNG (natural gas from the mix). This is a top 2 sort and note that XIV has been slowly migrating away from the top slot since 8.13.
The short term performance metrics (5-90 days) of this model have certainly been attractive and what's interesting is, despite the negative slope P6 in most of our other study portfolios, this P6 is upslope (its not parabolic) and looks poised for possible additional gains.
The volatility can probably traced to the FED and the uncertainty of the equity damage a pullback in quantitative easing would create. No one wants to be long through another 2008-2009 collapse.
Since you asked...thanks to Jim L. for the suggestions on XIV variations. Here's what happens when we add XIV (the VIX inverse) to the T11 hybrid model and pull UNG (natural gas from the mix). This is a top 2 sort and note that XIV has been slowly migrating away from the top slot since 8.13.
The short term performance metrics (5-90 days) of this model have certainly been attractive and what's interesting is, despite the negative slope P6 in most of our other study portfolios, this P6 is upslope (its not parabolic) and looks poised for possible additional gains.
Tuesday, August 20, 2013
A REAL Momentum Model...8.20.13
This is another version of the X sector model but we've juiced up the returns by adding XIV, the VIX inverse ETF that obviously behaves like a wildcat, so attention to money management stops is not suggested...its mandatory. The performance metrics are a bit scary and this is clearly a model best used by those willing and able to actively manage their account on a day to day basis using the P stops.
Note that this is NOT a delta neutral model...there are no beta offsets to the portfolio components....these are all ETFs that flourish in bullish environments. The way we control risk is simply by going to cash in times of market neutrality or bearishness...thereby further emphasizing the need for paying close attention to the stops.
Subscribe to:
Posts (Atom)