Tuesday, December 30, 2014

VIX Resolves....12.30.14

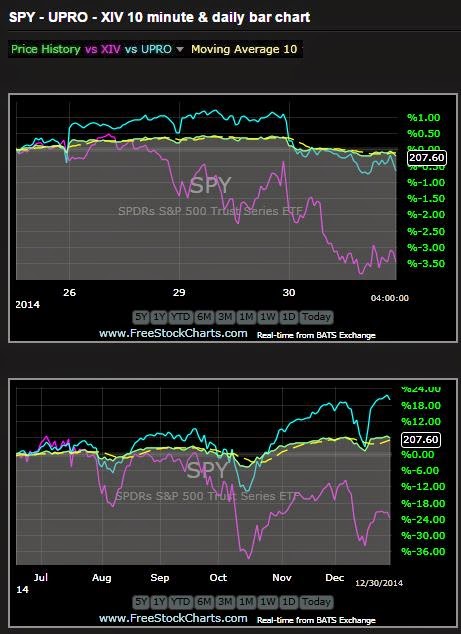
The VIX / XIV correlation divergence noted yesterday got resolved in favor of VIX today.
Despite low volume and a narrow advance/decline line the current M3 / LM indicators are bearish for tomorrow.
The revised M3 home site is now complete and details about the new M3/LM product can be viewed there. New subscriptions after Jan 10th will be $50/month.  Current subscribers will receive the current rate,
XIV should be at old highs given SPY strength but it continues to falter relative to the VIX (see chart below) and the TrendX chart (right side panel) is suggesting we may be in for a pullback.  We've seen this type of stepback off new highs before, which may extend for several days.
On the other hand here we are again at month's end (typically bullish) so the pullback may just be a gaming play by some big players to create a more attractive buying environment.

Monday, December 29, 2014

A Look at M3 2015....12.29.14

Here's a screen shot of today's M3 post just for those thinking about subscribing.  We've got a new look and some new display graphics.  The Lazy Man is now part of the model providing an array of risk/reard options that can be exercised according to individual trading goals.  The models are now greatly simplified from the original iterations but the graphics and metrics provide a solid foundation for evaluating the current odds environment.

Also of note, the VIX and XIV divergent correlation has completely fallen apart.  The VIX was up 6% today while XIV was up .75%.  See the XIV/VIX chart below.  Seems impossible but we've seen this before and the current instability will not last long. How it will be resolved is a big question.

Sunday, December 28, 2014

New Lazy Man - SPY version....12.27.14

This is a new version of the Lazy Man model and on a scale of 1 to 10 it's about a 9 for outright laziness.  Lazy Man (LM) can be used as a companion to M3 and in fact it will become a daily feature in the new M3 format to be rolled out in 2015...only a couple days away.
This is a floating 6 month lookback but I'll post the latest 2 year results tomorrow or Tuesday.
Here are some performance stats using a .7% limit stop for the following day based on the close.
 % of positive returns = 67.
Of the 45 losing days 21 sustained drawdown of 2% or less and 15 were stopped out at .7%.
There's only 3 inputs SPY, its inverse SH and SHY...out long term proxy for cash. On a risk scale this model offers very low drawdown (compare to SPY on metrics panel) , few potential surprises, narrow spreads on a robust options chain and no worries about execution of the limit stops.
Since we're only concerned with the # 1 ranked position, that's the only one shown.  The ALERT and PIVOT Trend in conjunction with the P6 and RSQ help gauge the likely odds of the current rankings.

Tuesday, December 23, 2014

New Highs...12.23.44

DOW 18000 and the SPY and IWM roll on.  Weakness in XIV was surprising after yesterday's pop but the lack of sellers may reverse next weak and this may be a prelude.  We remain in a seasonally
bullish mode while volatility is still looking for some traction.
Note the SPY TrendX in the right side panel.  We're getting to resistance levels on the TrendX and for the past 2 years the model has always bounced on of off the TrendX thresholds...just something to keep in the back of your mind as you overindulge in food and drink over the next few celebratory days. Have a Great Holiday.

Monday, December 22, 2014

Nuances of M3...12.22.14

Today was the first posting of the new M3 / M3R models.  Yes there are no performance improvements and the RSQ, P6 and associated equity curves look different (improved) from the previous version.  This is part of M3's evolution and refinement and adaptive nature.
I trade this model daily for multiple accounts and other family members do as well so I have a vested interest in making M3 a success. Long time Mosaic followers know that I'm very risk adverse and always follow a mantra of capital preservation.  The new M3 models embody these goals.
It may be surprising, but most of the model performance improvement derives from an in depth analysis of alternate stops and the decision to go forward with the simple 2 and 1.5 % limit stops.
These stops are wider than the previous ATR calculated stops but it turns out that giving the model "room to breathe" during daily volatility swings actually pays off handsomely in the end.
The other variable is in the rankings and the desire to decrease "lag" or the delay in moving out of a waning momentum position and into a rising momentum position.  The new M3 momentum algorithm has been very modestly accelerated...in fact over the rolling backtest of 120 trading days (2 years lookback) the average number of accelerated position rankings was 4, slightly more than 3%.
Again, it was the decision to adopt a wider stop spread than really added juice to the returns.
As stated in the M3 disclaimer all posted stops are strictly for the purposes of establishing performance benchmarks.  I'm not a financial adviser and you alone are responsible for when and if you decide to pull the trading trigger. Any stops posted as well as any rankings are strictly for the purposes of discussion and education.  Each trader can, and is encouraged to, develop their own risk management program according to his or her personal risk tolerance. M3 is simply a reflection of what I' doing on a day to day basis. I've discussed the various types of stops in a previous post and the limit stop is what I prefer and what is utilized in calculating the performance metrics of the models.
A very wise trader once told me "Anybody can get into a trade, it's when you exit that determines how successful you are".  I've learned the painful truth of that statement over several decades.
Note that both M3 and M3R look at 6 inputs on a daily basis but only the top 3 are displayed.
Here then are the recent 6 month equity charts for M3 and M3R>>>>>


Saturday, December 20, 2014

XIV's Stability in Question AND a NEW M3.....12.20.14

While the markets have enjoyed a tremendous surge XIV has faltered badly in comparison and the chart below shows the price/volatility disconnect that I've mentioned several times before.
Since M3 is designed to be adaptable I'm rolling out new versions of M3 now, one with volatility ETNs and one without.  Both models will be posted on a daily basis on the M3 site with limit stop values posted after the close.
These new versions of M3 embody considerable testing and retesting and are designed to be simple to implement both in terms of execution and money management.
The layout are also simplified and contain all the essential metrics and charts necessary to understand the current model rankings.  There's no second guessing the models...just enter the appropriate stops.
Here's a comparison of the M3 and M3R models using the limit stops of 2 and 1.5% respectively.
Starting in 2015 subscription rates for new subscribers will rise to $50/month.
Current subscribers' rate will remain at $30/month.


Thursday, December 18, 2014

Blockbuster Day....but....12.18.14

It was a blow-out day with the DOW up 438 points, the biggest one day point gainer in 2014.
While we may be on our way to new highs all around (IWM is already back to its highs) I thought it might be fun to run the recent swoon through the Ponzo time machine.  Here, for your entertainment enjoyment, is the not so merry multiple scenario forecast for SPY . . . note that the net average of projected equity paths has deteriorated from our last Ponzo update.