Here's the revised VTV chart set (to be released next week). I've added a P3 function to complement the P6 (P3 is slower). This begins to look like a moving average crossover or MACD chart now and helps define the nexus of Long/Short opportunities as will be discussed in future posts.. I keep talking about technical "normalcy" in the markets and these 6 charts provide a quick and reliable view of whether the markets are trending or choppy. There's a reason the charts are aligned the way they are. There are 3 pairs here: QQQ/SH, XIV/VXX and SPY/TLT.
The 3 charts on the left are equity positive, the 3 charts on the left are equity negative. Ideally, we want to see all 3 charts on the left sloping the same direction and all 3 charts on the right sloping the same direction. That's clearly not the current situation and a good reason to be wary of potential short term trades.
This conflicted view of the markets is supported by the current momentum rankings of VTV which show SPY with a higher ranking than XIV. This scenario is typically an indication that market volatility has reached (or is approaching) a short term low (remember XIV reflects the VIX inverse) = bearish. If the fiscal cliff, the current focus of bearish sentiment, appears to be somehow solvable, then all bets are off and we'll likely see a couple hundred point move up that will hold for at least a couple days. for now, it's the wait and see game for traders.
Now, back to T2, which all subscribers except one have opted to own. One thing to keep in mind when exploring with T2 is that not all portfolios lend themselves to momentum based rotational modeling...or, if they do, they require really tight risk controls, aka stops. Here's a couple sector portfolios to consider as a reflection of this thinking.
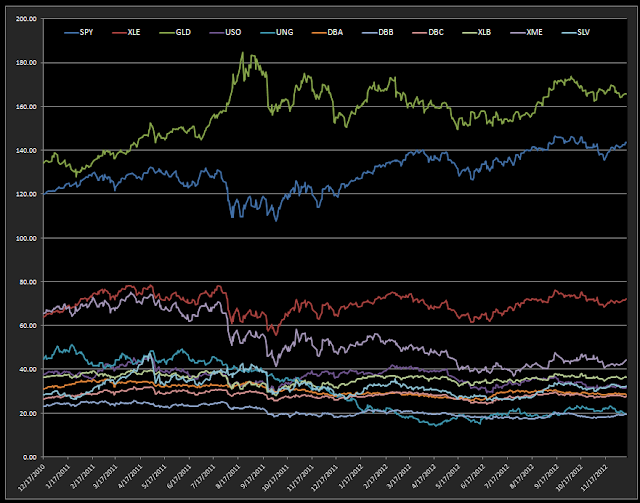
First...commodities..often cited by "experts" as an inflation proof tactic for avoiding losses. This model includes all the basic commodity groups, oil gold, agriculture, mining, basic materials, etc. See for yourself how it's fared relative to out default portfolio. Note the drawdowns. I've just selected the top 1 for analysis but the results don't get much better the more risk control (higher top#) that we select. Looking at the lower charts of the portfolio SPY and GLD are the only components that are even remotely attractive. The overall downward slope of most of the components dooms the success of this model from the get go. This may be a short seller's dream but as a longer term portfolio there's simply not enough positive momentum in this sector to beat the SPY unless you stricke like a black mamba and capture all the surges above the RSQ while avoiding all the drawdown below the RSQ line. Like I said....close attention and tight stops.

.Tomorrow, we'll look at another T2 portfolio that looks promising on the surface.


