Monday, December 17, 2012

Deconstructing the S&P with T2 & SPYDERS...12.16.12

This post is fundamental to understanding rotational models and identifying pockets of opportunity. Without going into too much nuance right now we'll use the SPYDER sectors ETFs to help isolate what's hot and what's not in the markets on a momentum basis and try to capture incremental grains along the way.
.
To provide a comparison benchmark we add SPY to our porfolio.  This gives us a 10 ETF model to examine and to see if there's any advantage to playing the sectors selectively based on momentum or whether we're just better to guts it out and hang with the SPY.  Turns out there are some benefits to playing the markets selectively both in terms of risk and returns.  In this case I've looked at the top 3.  With the T2 software you can load up this portfolio, save it as a separate file, and analyze the other possibilities.

As expected, money management is important but if we follow the simple RSQ and P6 guidelines we are way ahead of the buy and holders. While the top 3 chart mirrors the SPY chart it clearly shows higher lows and higher highs, the types of portfolio price behavior that we seek in order to get an edge.
To get a little different look at these sectors....here they are all together in the T2 composite chart. At first glance you'd probably be inclined to say..."well, they all look the same", and in fact they pretty much do.
It's when we apply a momentum algorithm like T2 to a sample mix like this that we may discover some nuggets of opportunity not readily apparent.

Friday, December 14, 2012

T2 Exploring and VTV View...12.14.12

Here's the revised VTV chart set (to be released next week).  I've added a P3 function to complement the P6 (P3 is slower).  This begins to look like a moving average crossover or MACD chart now and helps define the nexus of Long/Short opportunities as will be discussed in future posts..  I keep talking about technical "normalcy" in the markets and these 6 charts provide a quick and reliable view of whether the markets are trending or choppy.  There's a reason the charts are aligned the way they are.                      There are 3 pairs here: QQQ/SH, XIV/VXX and SPY/TLT.
The 3 charts on the left are equity positive, the 3 charts on the left are equity negative.  Ideally, we want to see all 3 charts on the left sloping the same direction and all 3 charts on the right sloping the same direction. That's clearly not the current situation and a good reason to be wary of potential short term trades.
This conflicted view of the markets is supported by the current momentum rankings of VTV which show SPY with a higher ranking than XIV.  This scenario is typically an indication that market volatility has reached (or is approaching) a short term low (remember XIV reflects the VIX inverse) = bearish.  If the fiscal cliff, the current focus of bearish sentiment, appears to be somehow solvable, then all bets are off and we'll likely see a couple hundred point move up that will hold for at least a couple days.  for now, it's the wait and see game for traders.

Now, back to T2, which all subscribers except one have opted to own.  One thing to keep in mind when exploring with T2 is that not all portfolios lend themselves to momentum based rotational modeling...or, if they do, they require really tight risk controls, aka stops.  Here's a couple sector portfolios to consider as a reflection of this thinking.
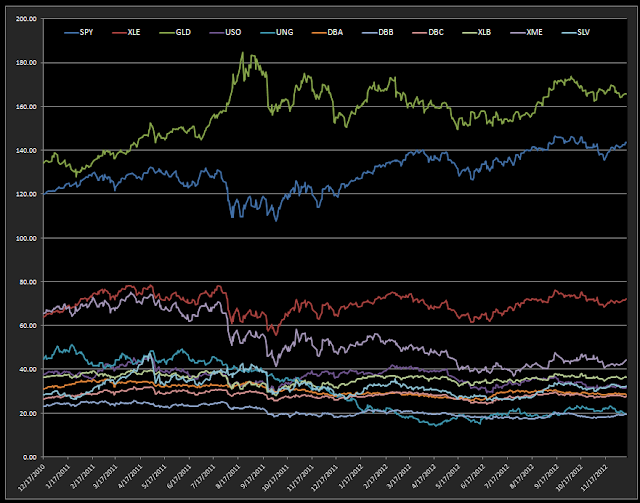
First...commodities..often cited by "experts" as an inflation proof tactic for avoiding losses.  This model includes all the basic commodity groups, oil gold, agriculture, mining, basic materials, etc.  See for yourself how it's fared relative to out default portfolio.  Note the drawdowns.  I've just selected the top 1 for analysis but the results don't get much better the more risk control (higher top#) that we select.  Looking at the lower charts of the portfolio SPY and GLD are the only components that are even remotely attractive.  The overall downward slope of most of the components dooms the success of this model from the get go.  This may be a short seller's dream but as a longer term portfolio there's simply not enough positive momentum in this sector to beat the SPY unless you stricke like a black mamba and capture all the surges above the RSQ while avoiding all the drawdown below the RSQ line.  Like I said....close attention and tight stops.
.Tomorrow, we'll look at another T2 portfolio that looks promising on the surface.

Thursday, December 13, 2012

T2 Bonds Only and VTV View...12.13.12

Based on reader feedback the ultra low drawdown models have gained a following.  Here's another one featuring a 5 ETF portfolio of bonds only and no need for following the Momentum rankings.. just hold all 5.  Note that the benchmark is TLT, not SPY.  I've made a few additional tweaks to the T2 program in the past few days and version 3 will be sent out this weekend.

In the big picture the markets continue to seek a new trend.  The chop is evident in the VTV rankings as seen below and mentioned yesterday.  While the XIV - VXX spread remains intact the collapse of QQQ and SH to slots 3 and 4 negates the opportunity for any short term trades (Long QQQ).  As of 90 minutes in today's market session both the Qs and SH are green while XIV has turned red.  The odds for a fiscal cliff solution seem remore at this point and Friday may be an ugly day if current bear sentiment prevails.

Wednesday, December 12, 2012

LM & TAQK Updates + a Long Term T2 ...12.12.12

The models are slightly underperforming the SPY on a short term basis but our volatility factor (drawdown) stills hold the edge. Both LM and TAQK remain in Hold mode and both the RM versions are Vested.  We might have picked up some gains in the Mosaic models by kicking into an ACCUMULATE mode back around Nov. 19th but the technical signals to confirm the underlying foundation for such a position were not present.  We continue to see the markets see-saw in anticipation of the fiscal cliff (now dubbed the dismal cliff by some in the media).  For now we'll look to the VTV setups to pick up some short term gains and preserve our capital.

Since you asked:  here's a 7 year look at the VTV really low drawdown model posted yesterday. In this case we do engage the top 2 strategy but the algorithm only looks at weekly bars, not daily bars as in the typical T2 model. All indications are this is a robust model requiring minimal maintenance and a providing a safe place to park some of those long term dollars that would otherwise be in money market or piddling CDs. Another attractive feature:  incredibly liquid...convert to cash in less than 5 minutes during market hours.  Note what happened in late 2008 when the SPY hit a nose dive.

And, here's the TAQK update.

Tuesday, December 11, 2012

T2, VTV applications,etc....12.11.12

Most of you now have the T2 software to play with and create your own model portfolios so I'll limit my previous focus on T2 for a while.  There are no new Alerts and the markets continue in conflict with Monday demonstrating a somewhat bizarre returns as QQQ, TLT and GLD were all green and XIV was red.  Today it's Apple that's driving the Qs and the materials sector is flying.
T2's selection of XLP and IWM since 11/29 has worked out well but the model still remains in a stopped mode per the short term RSQ and P6.
The VTV model continues to favor XIV (the VIX inverse=bullish) ranking and after today's Qs action we may see the rankings fall into the ideal alignment with Qs in #2 slot and SH in #5.  Until then we need to be sure that today's early rally is not just a short covering event.

Below is an example of one of many peripheral ways that the VTV Assist program (bundled with the VTV main program) can be used. While the VTV program is focused on capturing short term gains it can also be used to build long term portfolios with less than 6 components.  In this case the model holds all 5 ETFs in equal dollar amounts...and holds and holds and holds.  We just need to rebalance every month to make sure there are equal dollar allotments  in each ETF.  The results...we slightly beat SPY but the drawdown is miniscule. The RSQ of .98 tells the whole story. We actually don't even need to look at the Momentum rankings.

Monday, December 10, 2012

T2 Software and the VTV View...12.10.12

The T2 software was sent out this weekend to all subscribers who requested it.  The VTV software (2 separate programs) is now available also..go to the option 8 button on the main ETF Mosaic site to order.  The VTV software is both very simple and very powerful in helping to assess market momentum and to capture short term opportunities.  Risk management is critical with VTV...as can be seen by a quick look at the performance metrics of just trading the top 1 ETF in the 6 ETF mix.  Great returns but the potential drawdowns could cause a cardiac.
We can buffer the risk somewhat by trading the top 2, which basically cuts all number in half but the goal of VTV is really to make sure we're on the right side of the market at any given time so however each user decides to engage the program is a matter of personal risk tolerance.

On upcoming Mondays we'll look at some other ways to make use of VTV, some other VTV components and some other ways to use the power of inverse pairs to capture market opportunities.  VTV is the product of over a year's worth of research and I'll endeavor to gradually explain why it should be part of your trading (and investing) toolbox.

Below is a view of the lower VTV chart panel which illustrates the extreme volatility that trading high beta volatility (XIV and VXX) can incur.  Also note the volatility chart in the upper right hand side of the VTV Assist panel.  That's one of the reasons that the preferred trading vehicles for VTV are QQQ and SH...less volatility. 

Saturday, December 8, 2012

T2 Update...12.8.12

T2 remains in a stopped mode.  The version shown above is a partial view of the T2 software that will be emailed to all subscribers requesting it per the earlier ETFMosaic revised subscription notice.  A VTV option 8 revenue button has been added to the ETFMosaic homesite and that software module is also ready to go for those wishing to purchase.

Apple (20% of the NAZ100) continues to drag down the Qs and produced the odd situation Friday where both QQQ and TLT were red.  The Momentum rankings have detected this weakness and have stuck with XLP and IWM as top ranked slots since 11.30.12  Considering the underlying chop in the markets this is a tenuous ranking going into next week.  The equity markets are technically overbought and with more and more market prognosticators predicting that a substantive fiscal cliff solution will not be reached any time soon the gloom and doom sayers may drive the markets down ahead of the holidays. Watch out for any short covering rallies before getting too negative. 

The updated VTV ranking with the optimum XIV/VXX spread but QQQ and SH are not in the # 2 and #5 slot,s reflecting continued instability in the markets.The rankings on 12.5 were truly strange with QQQ most closely aligned with SH than TLT...again...an Apple phenomenon.