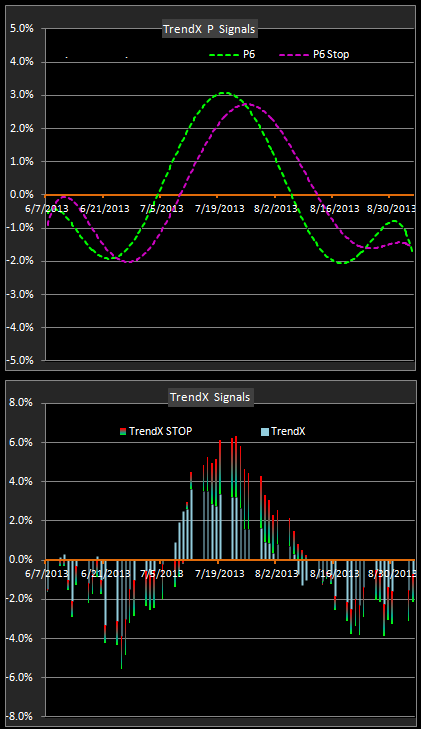
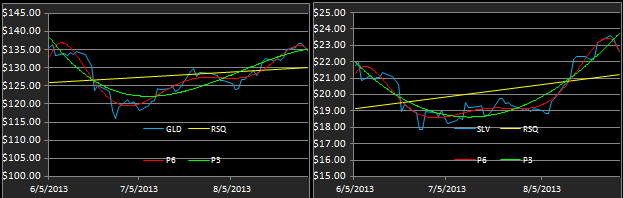
Continuing gains have put the X sector model on an upslope cross of the RSQ equity line although a quick check of the short term metrics panel revealed that SPY has actually declined a bit over the past 30 days.. The new P6 kiss is a bullish indicator and suggests further upside may be in order.
Much of the recent market enthusiasm has been widely attributed to the delay in a Syrian attack that would produce consequences of unknown proportions. This is a market that wants to go up...... but
We'll have to see how the President's message on Syria will be received at Wednesday's open.
Best guess is that the markets will hold until there are actually missiles in the air...then...its anybody's guess.
Work on the currency/country model is proceeding and a full new T11 portfolio will be presented tomorrow.
Tuesday, September 10, 2013
Monday, September 9, 2013
A New Model (in progress)..9.9.13
The response to the new ALPHA model has been enthusiastic and several readers have asked if I could create a model that focused more on the countries and the currencies as an alternate tactical approach to trading forex (FX) (foreign exchange markets). I use to trade FX on a daily basis using an overnight bracket order approach that produced steady and low risk returns. I frankly don't know why I stopped trading the system since it required so little attention but these recent inquiries may be an excuse to revisit the FX markets and the safety of bracket orders. There are more than a few trading gurus who are forecasting major economic upheaval similar or worst than the 2008 crash based on the largely overlooked debt crisis. Under such a scenario the value of equities and bonds would decrease dramatically, short selling would probably be restricted (as in the past), inflation would crush the value of cash, and one of the few opportunities for equity growth would be in the currency markets. Of course, this is just a few guys trying to get the rest of us really worried.
This new model is a work in progress and designed to focus more on short term returns (less than 90 days) in lieu of a longer term investment perspective. The momentum ranking approach is still used but, as with the ALPHA model, paying attention to the stop signals is critical. As with the development of previous models I generally start with a larger basket of portfolio candidates and then track the winners and cull the losers in a momentum based model. Such is the case here where we start with a fairly broad stroke portfolio and then create a couple 6 component models which are later combined into a larger 11 component version.
This is a blend of ETFs with just a few basic metrics like daily volume and price volatility defined to help see how thay might interact with one another.
And, as a first draft of a 6 ETF model, here's one portfolio (below) that has performed well on the short term metrics, but obviously underperformed the SPY longer term. As I mentioned, this is just a starting point, but the results look very encouraging for creating a more robust and sustainable equity curve while at the same time looking at trading and investment opportunity through a different portfolio blend than either the APHA, X Sector or DF (equity/bond default models). The model currently likes the China and Canada ETFs and has for quite a while (the duration of the recently upslope P6).
This new model is a work in progress and designed to focus more on short term returns (less than 90 days) in lieu of a longer term investment perspective. The momentum ranking approach is still used but, as with the ALPHA model, paying attention to the stop signals is critical. As with the development of previous models I generally start with a larger basket of portfolio candidates and then track the winners and cull the losers in a momentum based model. Such is the case here where we start with a fairly broad stroke portfolio and then create a couple 6 component models which are later combined into a larger 11 component version.
This is a blend of ETFs with just a few basic metrics like daily volume and price volatility defined to help see how thay might interact with one another.
And, as a first draft of a 6 ETF model, here's one portfolio (below) that has performed well on the short term metrics, but obviously underperformed the SPY longer term. As I mentioned, this is just a starting point, but the results look very encouraging for creating a more robust and sustainable equity curve while at the same time looking at trading and investment opportunity through a different portfolio blend than either the APHA, X Sector or DF (equity/bond default models). The model currently likes the China and Canada ETFs and has for quite a while (the duration of the recently upslope P6).
Sunday, September 8, 2013
Gold & Silver Prospects...9.8.13
Here's an update of Friday's closing signals on the ALPHA model, which has recently been dominated by the gold and silver ETFS...GLD and SLV.
The model has clearly been hit by the expected reversal in momentum following a dramatic parabolic (and profitable) rise. The good news would appear to be that the metals are beginning to look oversold...with the P6 on the 3 month chart now below the RSQ equity line and the TrendX P6 signals approaching the zero line. However, the word "beginning" must be emphasized. Based on the behavior of these technical signals in the past we should expect continued weakness before a true buying opportunity presents itself in these 2 ETFs.
To confound these expectations Jim Rogers, arguable one of the greatest commodity traders of all time, recently voiced the opinion that gold is in for a more substantial retreat than most traders may expect and he forecast a possible low at the $1000/ounce level (currently around $1300). As if to reinforce that forecast here's a recent article from FUTURES magazine that makes a similar look forward based on a supply and demand perspective.
Below is a composite chart that looks at the SPY (shaded area) versus SLV, XLU and GLD over a 2 year lookback. Despite the recent rally that has produced nice returns for the ALPHA model the chart clearly shows that holding gold and silver over the past 2 years has not been a happy situation as they have both been in a steady decline with gold having lost 25% and silver having lost 45% of its value over that time frame. The foremost conclusion to be drawn from this chart is that tight risk management is absolutely crucial in order to protect your equity in this model as we are really bucking the curve by making GLD and SLV our investment choices and the positions must be considered short term holds...not long term investments.
The model has clearly been hit by the expected reversal in momentum following a dramatic parabolic (and profitable) rise. The good news would appear to be that the metals are beginning to look oversold...with the P6 on the 3 month chart now below the RSQ equity line and the TrendX P6 signals approaching the zero line. However, the word "beginning" must be emphasized. Based on the behavior of these technical signals in the past we should expect continued weakness before a true buying opportunity presents itself in these 2 ETFs.
To confound these expectations Jim Rogers, arguable one of the greatest commodity traders of all time, recently voiced the opinion that gold is in for a more substantial retreat than most traders may expect and he forecast a possible low at the $1000/ounce level (currently around $1300). As if to reinforce that forecast here's a recent article from FUTURES magazine that makes a similar look forward based on a supply and demand perspective.
Below is a composite chart that looks at the SPY (shaded area) versus SLV, XLU and GLD over a 2 year lookback. Despite the recent rally that has produced nice returns for the ALPHA model the chart clearly shows that holding gold and silver over the past 2 years has not been a happy situation as they have both been in a steady decline with gold having lost 25% and silver having lost 45% of its value over that time frame. The foremost conclusion to be drawn from this chart is that tight risk management is absolutely crucial in order to protect your equity in this model as we are really bucking the curve by making GLD and SLV our investment choices and the positions must be considered short term holds...not long term investments.
Thursday, September 5, 2013
X Sectors Remain in CASH..9.5.13
Despite the marginal rally effrots of the past few days the markets are not displaying any momentum trends that can be tracked with our models and CASH is still the P6 indicated position for all models.
A closer look at the X sector model shows it virtually neck and neck with SPY on both a short and long term basis...thereby revealing the lack of momentum in any particular sectors. This is actually an abnormal situation and shows the lack of leadership and commitment of capital in the markets.
If we take a closer look at what the TrendX signals are showing for this model we are confronted with a distinctly negative view of the current momentum rankings. This doesn't mean the rankings aren't working...what it means is 2 things:
(1). The disparity between momentum strengths in the various components is very slight (no leadership) and
(2) Remaining vested in the model rankings will mean that you will lose money slower than if the rankings had been ignored.
A closer look at the X sector model shows it virtually neck and neck with SPY on both a short and long term basis...thereby revealing the lack of momentum in any particular sectors. This is actually an abnormal situation and shows the lack of leadership and commitment of capital in the markets.
If we take a closer look at what the TrendX signals are showing for this model we are confronted with a distinctly negative view of the current momentum rankings. This doesn't mean the rankings aren't working...what it means is 2 things:
(1). The disparity between momentum strengths in the various components is very slight (no leadership) and
(2) Remaining vested in the model rankings will mean that you will lose money slower than if the rankings had been ignored.
Wednesday, September 4, 2013
P6 Still Argues for CASH..9.4.13
The bounce today did stick better than the previous attempts over the past 3 days but the leaderboard was not uniform and once again we are in a period of selective momentum among stocks, making our ETF approach of blending risk a bit more difficult.
Over in the ALPHA model silver and gold took heavy hits, supporting the previous signals to seek the safety of CASH rather than trying to buck the new downslope P6 trend in the top 2 sort.
Here's a screen shot of the fuller graphics panel for ALPHA as well as a closeup of the 2 new TrendX charts.
The upper chart is actually the P6 signal of the TrendX and the P6 signal of the TrendX 10 period moving average. The crossover of the two P6 signal lines is considerably smoother than the cross of the equity line and the equity line P6....with the intent of easing the identification of practical money management stops.
Over in the ALPHA model silver and gold took heavy hits, supporting the previous signals to seek the safety of CASH rather than trying to buck the new downslope P6 trend in the top 2 sort.
Here's a screen shot of the fuller graphics panel for ALPHA as well as a closeup of the 2 new TrendX charts.
The upper chart is actually the P6 signal of the TrendX and the P6 signal of the TrendX 10 period moving average. The crossover of the two P6 signal lines is considerably smoother than the cross of the equity line and the equity line P6....with the intent of easing the identification of practical money management stops.
Tuesday, September 3, 2013
Rally Fizzles, Again..9.3.13
The markets got a nice pop at the open but the NYAD was in steady decline for the remainder of the day.
The temporary reprieve from a Syrian intervention gave cause for some optimism but the odds are that sooner or later POTUS is going to pull the trigger and create some clear destabilization of the evil-doers.
While gold and silver rallied nicely the P6 signals are still in a reversal pattern with the equity line basically flat for the past few days.
Over on the X sector model here's a view of some of the new visuals designed to help identify appropriate money management stops. Needless to say...the signals are all arguing for CASH versus vested positions.
The temporary reprieve from a Syrian intervention gave cause for some optimism but the odds are that sooner or later POTUS is going to pull the trigger and create some clear destabilization of the evil-doers.
While gold and silver rallied nicely the P6 signals are still in a reversal pattern with the equity line basically flat for the past few days.
Over on the X sector model here's a view of some of the new visuals designed to help identify appropriate money management stops. Needless to say...the signals are all arguing for CASH versus vested positions.
Sunday, September 1, 2013
P6 Stop Fires for ALPHA Positions..8.30.13
There were some updating problems with the Yahoo data since Friday although those now appear to have been resolved. The models should now update through 8.30.13.
Friday saw a continued decline in the markets and parallel weakness in SLV and GLD and the P6 on each chart has now turned downslope....as was suspected in Thursday's post.
The metals have had a great run but the odds now favor a retreat to the RSQ line as a minimum. Booking recent gains now and waiting for a signal confirming the next leg up is one money management tactic that will avoid possible drawdowns.
On the hybrid model which is now termed ALPHA we note the migration of gold off the top 2 sort while (surprisingly) silver is still in the sort.
It is at times like this that close attention to the larger P6 stop is important and we can see that an equity/P6 cross occurred on Friday and the 5 day metrics show that a top 2 sort drawdown is greater than our SPY benchmark...two strong arguments for cash positions.
For the Fall update to the program we have added a gradient based P6 signal to the 3 month chart to help identify trend exhaustion and reversal points as well as a gradient based TrendX indicator to be used a confirming stop signal that actually generates several degrees of risk exposure for closing vested positions as well as several impact points for possible new vested positions.
The platform is still in beta testing but a late Fall release is expected.
Friday saw a continued decline in the markets and parallel weakness in SLV and GLD and the P6 on each chart has now turned downslope....as was suspected in Thursday's post.
The metals have had a great run but the odds now favor a retreat to the RSQ line as a minimum. Booking recent gains now and waiting for a signal confirming the next leg up is one money management tactic that will avoid possible drawdowns.
On the hybrid model which is now termed ALPHA we note the migration of gold off the top 2 sort while (surprisingly) silver is still in the sort.
It is at times like this that close attention to the larger P6 stop is important and we can see that an equity/P6 cross occurred on Friday and the 5 day metrics show that a top 2 sort drawdown is greater than our SPY benchmark...two strong arguments for cash positions.
For the Fall update to the program we have added a gradient based P6 signal to the 3 month chart to help identify trend exhaustion and reversal points as well as a gradient based TrendX indicator to be used a confirming stop signal that actually generates several degrees of risk exposure for closing vested positions as well as several impact points for possible new vested positions.
The platform is still in beta testing but a late Fall release is expected.
Subscribe to:
Posts (Atom)