Saturday, April 5, 2014

QQQ Plunges....4.5.14

A really bad day on the Qs on huge volume has put them in the red for 2014.  Is this is an omen for more downside to come or will we see the usual dip buying and then a pop to new highs? 
That's the $64 question.
One of the very interesting factors in Friday's swoon was the relative strength of the NYAD (NYSE advance/decline line.  We typically see downtrend bottoming when the NYAD drops to the low teens or below (intraday readings below .10 occur approximately 1% of trading days and are usually driven by really bad earnings or geopolitical news). 
The Above chart shows 130 minute bars, so every 3 bars reflects a trading day (6.5 hours =390 minutes/3= 130 minutes).  And we can see that the closing NYAD level was .54...a moderately bearish reading....but not a panic or capitulation level.  NYAD reflects NYSE stocks.
Clearly the Qs were displaying a different fear pattern on Friday as can be seen form the chart below.
The white and blue lines on both charts are the 7 and 20 day moving averages.

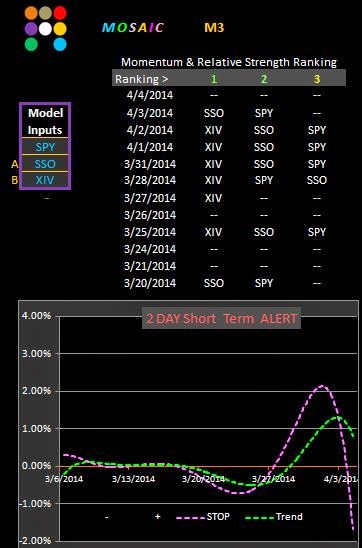
Here's the current status of the M3 SPY.  Our short term ALERT did a good job of letting us know that caution was warranted 2 days ago asw XIV began its fade and SPY began to wane.
Our next opportunity to become vested will likely occur when the pair signals cross the zero line and we'll assess the odds when that happens.

The Qs look a bit risk prone based on a similar M3 run>
In the case of the Qs the short term ALERT fired on the same day but the rankings actually warned us out of the trade a day earlier than in the case of the SPY by failing to even register in the rankings scale....always a side of weakness or impending reversal.
For now the pair charts look very similar to the SPY version with the exception that there is now a zero line cross of the QQQ/QLD pair (A).  This situation may suggest a long QQQ trade for Monday but the QQQ/XIV signal has not confirmed so the element of risk is high.