It was a wild ride on the markets today as trend momentum crossed the zero line several times before closing in the red (mostly due to a trap door opening in the last 5 minutes of the session).
For now we're still in CASH although the run up midday did reveal some buying potential (or was that short covering?). Tomorrow will likely reveal the answer to that question as large traders now have an opportunity to effectively "reload" their positions from today and expose their true intentions.
Worries about FED tapering, moderated by luke warm projections for economic growth next year have supposedly created the recent market malaise but, truth be told, the talking heads are just that and none of them have any vested interest in your accounts or your welfare...so always be suspicious of what the paid "experts" espouse and exert every effort to preserve your capital....that's my thinking There's always someone out there who will say "I told you so" after a market pop or reversal, but hindsight (or hope) is not a great viewpoint for dealing with tomorrow.
To augment the new M6 and M3 software there are now three separate free access sites I've constructed on the freestockcharts platform. Why 3? Basically because each serves a different function and they really suck up the bandwidth so putting them all on one page would probably slow most computers down to crawl speed and seriously hamper the simultaneous use of multiple applications.
The first site looks at a SPY overview as well as the dynamics of each of the default M6 models...Small World, Schwab and VEGA (bullish). This site has been operational for 3 months and has just be updated with a new timescale and refined graphics.
Then there is a site dedicated exclusively to TrendX signals.
And there is a site dedicated to VIXEN setups, mostly attractive to intraday and swing traders.
Users can simply bookmark the sites and link to as desired.
Close each site at the end of the day or you may experience a data feed lock at startup the next day.
These 3 sites are provided to help examine the shorter term dynamics of the various models, the SPY and select ETFs such as XLE and EWG, which can be traded with the M3 SPY Trader platform.

Actionable Risk Opportunities, Tactical Musings and Timing Indicators for Investors
Wednesday, December 4, 2013
Tuesday, December 3, 2013
SPY Weakness Continues..12.3.13
For more info on the new M3 SPY Trader and M6 models go to the home site and scroll down the page for full details. A special offer for currently registered users is attached at the bottom of the Software tab.
It went from bad to worse for most of the markets today and the only saving grace was that fact that the close was considerably above the low of the day. Based on three days of selling there is a mild oversold technical condition afoot but there's also plenty of downside potential if that's the way the market swings.
The SPY trader has now moved to the greatest possible bear alignment...SPY, SSO and XIV and all the STOPS have signaled CASH .
I'm showing both the pair charts to calrify how SPY reacts with SSO (A) and XIV (B). The SPY/XIV pair was the earliest of the STOPS to signal danger but the SPY/SSO was close behind.

 Finally, the equity curves with the RSQ and P6 overlays. Note the alert to cash on the 27th as the P6 crossed over the ewuity line and then again as P6 crossed over the RSQ line... reinforcing the warning.

It went from bad to worse for most of the markets today and the only saving grace was that fact that the close was considerably above the low of the day. Based on three days of selling there is a mild oversold technical condition afoot but there's also plenty of downside potential if that's the way the market swings.
The SPY trader has now moved to the greatest possible bear alignment...SPY, SSO and XIV and all the STOPS have signaled CASH .
I'm showing both the pair charts to calrify how SPY reacts with SSO (A) and XIV (B). The SPY/XIV pair was the earliest of the STOPS to signal danger but the SPY/SSO was close behind.


Monday, December 2, 2013
SPY Trader Now Negative...12.2.13
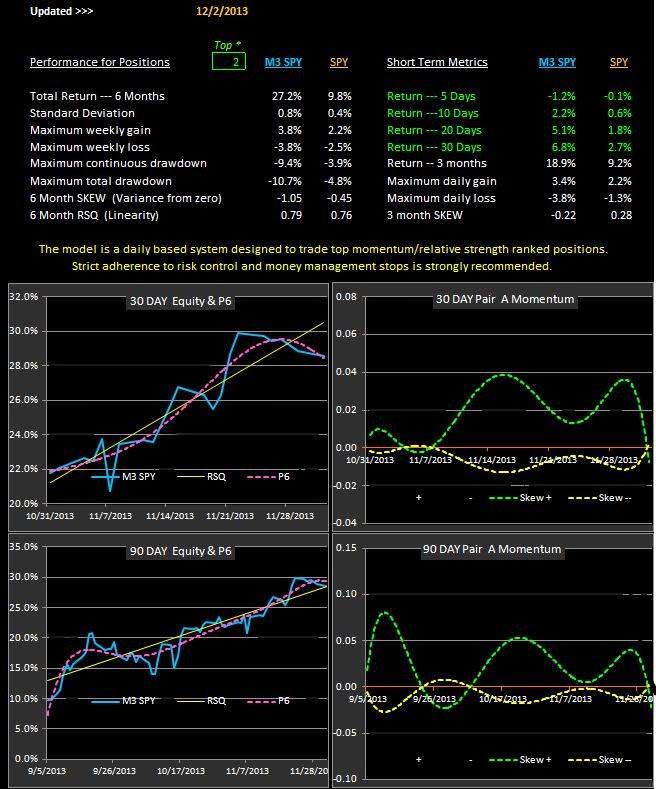
The short term ALERT did a good job of putting us in CASH last week and a cusory look at the technicals suggests there may be more downside to come.
Keep in mind that previous 3 day downturns have produced buying spurts so once again we just have to take the signals one day at a time.
The thing to keep in mind regarding the SPY Trader is that this IS NOT a delta neutral trading model.
Generally speaking what we look for is a ranking of XIV, SSO and then SPY....this is bullish momentum at its best. If this is not the current ranking then we must be suspect of Long positions, and when the short term ALERT turns down, the P6 slope goes negative or the pair % chart crosses at the zero lined then CASH is highly recommended.

Sunday, December 1, 2013
Thanksgiving Update...12.1.13
Talk about the little guy moving the markets! Friday was one of the lowest volume days of the year but volatility was a real eye opener as the morning bullish pop was erased and then negative by the end of the day (shortened session). A day trader's delight.
For longer term investors the implications of Friday's collapse remain to be seen if only because of the low volume. Monday being the first day of the month is expected to be bullish so any weakness may be a harbinger of weakening momentum of SPY.
That's exactly what we're seeing in the SPY Trader model as XIV has moved out of the #1 spot and the money management stops put us in a CASH position back on the 25th. This same weakness is reflected in the equity curve and the SPY/SSO pair chart is now at the make or break zero line.

 Meanwhile, over on the Small World model the equity curve has continued to climb largely due to the strength of EWG (Germany). In contrast to the SPY Trader, Small World in still in a vested mode although the 90 day charts are clearly showing a negative tone relative to the 30 day charts so we're keeping a close eye on a possible reversal of the 2 Day Alert so as to preserve recent gains.


For longer term investors the implications of Friday's collapse remain to be seen if only because of the low volume. Monday being the first day of the month is expected to be bullish so any weakness may be a harbinger of weakening momentum of SPY.
That's exactly what we're seeing in the SPY Trader model as XIV has moved out of the #1 spot and the money management stops put us in a CASH position back on the 25th. This same weakness is reflected in the equity curve and the SPY/SSO pair chart is now at the make or break zero line.

Wednesday, November 27, 2013
Slow churn up continues...11.27.13
Another day, another couple points up. Friday's a short sesssion and expect uber low volume.
The thing with such days, however, is that small traders who normally really can't effect market momentum often do manage to pump up stocks on days like Friday when the big traders are on holiday. Coupled with the end of the month bullish thing Friday could be surprisingly strong.
We shall see.
Info on the new SPY Trader has been added to the Mosaic homesite. Just scroll down on the page until the SPY Trader panes are visible. I'm adding a few final tweaks this weekend and then next week the platform will be released. Pricing will be modest.
At the same time that bullish signals are seemingly everywhere we are seeing cracks in XIV momentum, usually a telltale that the underlying SPY is weakening. Once again this may be the product of the low volume holidays, or perhaps something more threatening.
For now we have a cautiously neutral posture with the TrendX closing dead on the zero line.
 And below is clear evidence that the XIV is sinking, meaning the VIX is rising = caution flag.

 Finally, just as a heads up....the TrendX 2 day ALERT STOP has now crossed down through the trend line and the equity curve has also turned slightly down in the past 2 days...suggesting the risk/reward profile is weakening ......adding fuel to our cautious stance.
The thing with such days, however, is that small traders who normally really can't effect market momentum often do manage to pump up stocks on days like Friday when the big traders are on holiday. Coupled with the end of the month bullish thing Friday could be surprisingly strong.
We shall see.
Info on the new SPY Trader has been added to the Mosaic homesite. Just scroll down on the page until the SPY Trader panes are visible. I'm adding a few final tweaks this weekend and then next week the platform will be released. Pricing will be modest.
At the same time that bullish signals are seemingly everywhere we are seeing cracks in XIV momentum, usually a telltale that the underlying SPY is weakening. Once again this may be the product of the low volume holidays, or perhaps something more threatening.
For now we have a cautiously neutral posture with the TrendX closing dead on the zero line.

Monday, November 25, 2013
M3 SPY Trader...11.25.13
Equities went up and then went down today, resulting in a narrow range day. For tomorrow we still have the end of month and seasonal bullish bias. which is historically most exaggerated on the day after Thanksgiving.
The SPY Trader remains bullish and the recent performance metrics are attached.
There will be no post Tuesday but a detailed breakdown of all the new SPY Trader components will be posted on Wednesday along with an explanation of the SPY/SSO and SPY/VIX 5 %change pair charts.


The SPY Trader remains bullish and the recent performance metrics are attached.
There will be no post Tuesday but a detailed breakdown of all the new SPY Trader components will be posted on Wednesday along with an explanation of the SPY/SSO and SPY/VIX 5 %change pair charts.

Saturday, November 23, 2013
TrendX Points Higher...11.23.13
Today's post will conclude our little study of the TrendX charts site and the implications of the charts signals.
Next week we'll look at what the % change pairs studies show relative to the TrendX and the P6.
The following week (after Thanksgiving) we'll finally release the new M6 models and the SPY Trader.
Approaching next week the TrendX signals are bullish and, coupled with traditional bullish seasonality before turkey day and the end of month typical bullish bump, can Dow 17000 be a possibility?
We are technically overbought but that hasn't dimmed market enthusiasm before so for now we just take it one day at a time.
Although the SPY VIXEN was in full bull mode all day long the TrendX was a bit more iffy, especially in afternoon trading, and at the close we were actually close to the zero line IN MOMENTUM...while price was still rising.
This was an unusual divergence between the VIXEN and the TrendX and illustrates the utility of looking at a third conforming chart pattern....the SPY,SSO,XIV Trader chart. Shown below....
 The SPY, SSO XIV Trader was clearly bullish all day..displaying the picture perfect relationship of the 3 ETFs that basically guarantee rising prices. As long as we don't see a significant divergence from the XIV/SSO alignment then price will continue to follow the slope of the price bars. This works in inverse also...when the 3 ETfs are all pointing downslope its best to seek cash.
 Finally, here's a quick look at the SCHWAB model and what's interesting here is the pop in SCHE, the emerging markets ETF. On Friday morning a number of analysts argued that the emerging markets have lagged the other indices and are due for a good run... This may be a harbinger of that pop.
Meanwhile, SCHH (housing) looks awful.

Next week we'll look at what the % change pairs studies show relative to the TrendX and the P6.
The following week (after Thanksgiving) we'll finally release the new M6 models and the SPY Trader.
Approaching next week the TrendX signals are bullish and, coupled with traditional bullish seasonality before turkey day and the end of month typical bullish bump, can Dow 17000 be a possibility?
We are technically overbought but that hasn't dimmed market enthusiasm before so for now we just take it one day at a time.
Although the SPY VIXEN was in full bull mode all day long the TrendX was a bit more iffy, especially in afternoon trading, and at the close we were actually close to the zero line IN MOMENTUM...while price was still rising.
This was an unusual divergence between the VIXEN and the TrendX and illustrates the utility of looking at a third conforming chart pattern....the SPY,SSO,XIV Trader chart. Shown below....

Meanwhile, SCHH (housing) looks awful.
Subscribe to:
Posts (Atom)