Showing posts sorted by relevance for query seeking alpha. Sort by date Show all posts

Friday, March 22, 2013

T2 Seeking Alpha Update..3.22.13

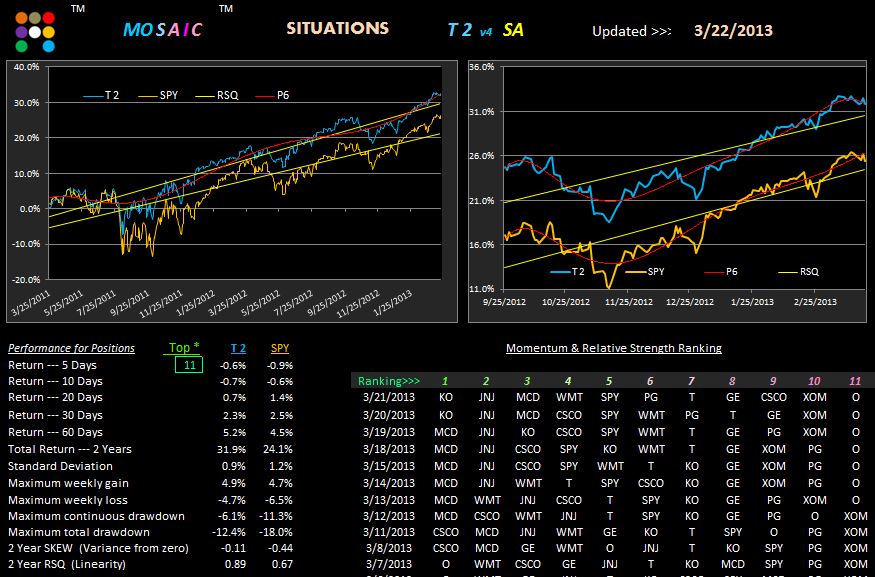
Today we check in on the Seeking Alpha portfolio mentioned several times in previous posts. This is a portfolio of stocks, not ETFs so we should expect greater volatility than the T2 default model.
In fact, a top 2 sort of the portfolio actually reveals a better RSQ than SPY and a better drawdown profile. 
Conclusion...the Seeking Alpha team has made some good picks longer term although short term the model has faltered when we only consider the top 2.
Another view using a top 11 sort...all in...shows returns more consistent with the SPY benchmark, and still displaying improved RSQ and lower drawdown.

Monday, July 1, 2013

Seeking Alpha Model Update 7.1.13

We're 6 months into the year so this seemed like a good time to review how the Seeking Alpha (SA) stock portfolio was holding up in the midst of recent volatility.
Turns out....so far, so good.

As we have noted previously, once a stock gets rolling it tends to stay rolling in a #1 or 2 slot for a week to 10 days.  That was certainty the case recently with CSCO and GE although the momentum now appears to be shifting to JNJ and MCD.

We're still encountering a few market volatility surges driven my earnings reports and the questionable political stability of the mid East but the markets are firming up half way through the first day of July.

Note that the SA model is in a CASH model per our P6 and RSQ money management guidelines so, as with the other models, we remain in a wait and see posture.


Tuesday, April 9, 2013

T2 Seeking Alpha stocks still bullish, but...4.9.13

This is an update to the Seeking Alpha stock portfolio (stocks selected in January by the SA Team as offering the the greatest growth potential in 2013).  There have been a few bumps along the way (there always are) but the short term top 2 metrics look good. 
Current situation shows the 2 year P6 downslope and the 6 month P6 upslope and dead on the RSQ line however, so no consensus signal for confidence at this time.
Here's a closer look at the top 2 component charts showing the momentum surge in both issues.

Wednesday, April 3, 2013

T2 Seeking Alpha Update..4.3.13

It's been 7 trading days since the last check on the Seeking Alpha stock based model, so here's the current state of affairs using a top 2 sort.
JNJ, WMT and KO continue to dominant the top 3 slots but both KO and WMT look overextended at the moment and the leader board may be about to change.
The SA model has performed well over most time frames although somewhat lagging on the 60 day.

On the 6 month chart the equity line has just crossed above the RSQ stop line and the P6 is upslope, so from a technical perspective the model is in a "risk on" mode (vested).  Today's market deterioration may result in at least a short term change in momentum however so caution is advised at this juncture. 

On the 2 year chart the equity line is above the RSQ but P6 is down slope..a situation that has not occurred since 7/5/11 to 10/5/11...which is another caution to scale back on positions and wait for a more opportune investment scenario.

Wednesday, January 2, 2013

T2 Alpha stock porfolio...1.2.13

I'm postponing the TAQK nd LM updates until Thursday while the metrics get adjusted for 2013.
As of 60 minutes in today the SPY is up 420 points in the last 2 days, while bonds are showing moderate weakness. Gold is also in a run up and our equities biased LM model is likely to show gains relative to TAQK in tomorrow's post.  AAPL is up another 3% today, helping to push QQQ to almost equal gains.
On the volatility front VIX is down 13%, contributing to a 22% decline in the past 2 trading days.

One of the sites I frequent is Seeking Alpha.  I use to contribute articles but the SA editorial team determined by submissions were "too technical" for their average reader to understand.  Nuff said.
Here's their stock picks for a 2013 model portfolio.
I've plugged their "Starting Lineup" portfolio into T2 just for fun.  We're not using LNCO because its only been live for 2 months...not long enough to develop metrics.  Plus, I've used SPY as the benchmark which, because of the way T2 works, may actually become a rank 1 or 2 sometime during the year.
Again, this is just for fun.  You can see how the top 1, 2, 3, etc of this portfolio pan out relative to our default model. And, you can play around with this thing and enter your own favorite stocks to see how they have fared relative to the Alpha picks.

Wednesday, January 8, 2014

Seeking Alpha with SPY...1.8.14

Alpha refers to the incremental value that can be added to a benchmark portfolio by engaging any variety of money management tools and tactics.  For almost all of our tested models SPY has been used as that benchmark...generally the highest volume ETF on any given day and indicative of the performance of the the biggest 500 S&P companies measured by capitalization.
Its a hard act to follow, as they say, and the question is often asked..."why not just trade SPY?"

This question is, in fact, the underlying reason that the M3 platform was developed.  Its momentum and relative strength algorithms are faster than the M6 platform and much faster than the M11/T11 platform.  M3's pairs charts are configured somewhat differently than M6 and the overall time frame is just 6 months to reflect the trading versus investing intent of the platform.

While all the platforms benefit from close observation of money management stops, with M3 its absolutely critical to follow the signals....that's due in a large part to the increased volatility risk incurred by trading XIV and SSO.  Caveat emptor!!!!

Here's the current report with the AUTO STOP turned on.  Recent results have been stellar based largely on the almost bizarre behavior of XIV relative to SPY...but M3 successfully saw through the market fog and showed the path.


Friday, January 18, 2013

2 Stock Portfolios for 2013...1.18.13

For those seeking to delve into stock models using the T2 approach here are 2 sample portfolios.
The first, SA, is based on the previously posted Seeking Alpha model and is based on their considerable research and experience.
The second, WS, is based on a Reuters article that popped up yesterday and identified Wall Street projections for the top earnings companies in 2013.  They had 10 recommendations so I've added SPY as a benchmark, but it still remains part of the portfolio.
You can play around with these as you wish with the T2 software.
Try a top 1 setting and the net returns pop...but at the expense of increased risk.  Hence..and I know everyone is tired of me saying this,,,but watching the short term action around the RSQ and P6 is critical to not letting your gains slip away.
With the T2 software you can just save each model portfolio as a separate file and load and close as you choose.
Note that GE and WMT appear on both lists and that the SA model involves a bit more diversity than WS.

Today's market has just turned red at 1 hour in.  The VIX is at 13....that's low....and regular VIX traders are probably savoring the mean reversion setup that says long the VIX at 14, short at 20.  That setup worked for quite a while, but it's currently in jeopardy.
It's monthly options expiration today so expect a few gyrations along the way although volume is currently lagging and Apple's again below $500.
Monday the markets are closed but Tuesday we'll look at a T2 model using just commodities.

Wednesday, February 6, 2013

LM & AB Updates...2.6.13

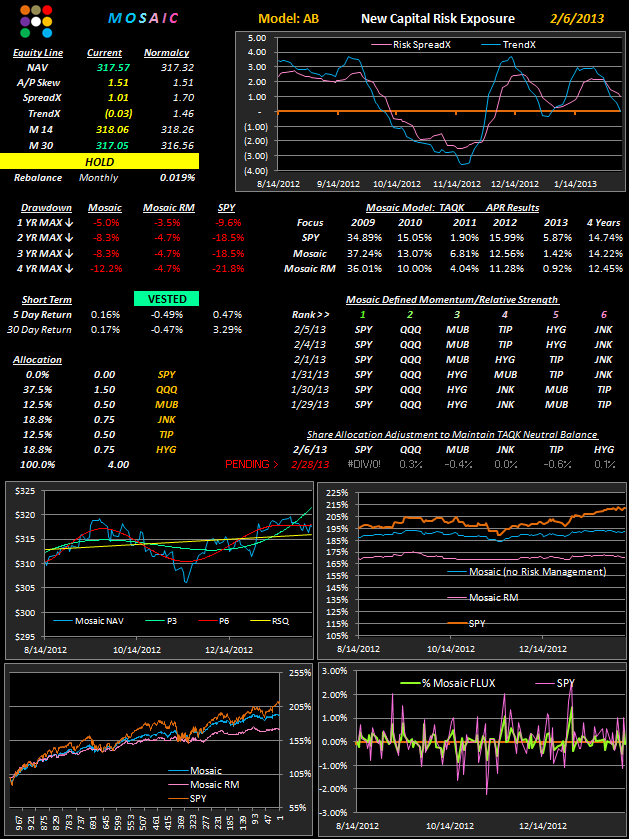
Our tactical allocation models are starting out the year poorly...that's the bottom line.  It also supports my belief that, although the models worked well in the past 4 years, this year might be different.  Hence my push to refine the T6 methodology in several iterations.
I had a comment yesterday that a simple allocation model would be appreciated and LM and TAQK models were designed with that goal in mind. Going forward however I think low risk capital appreciation may require a more strategic approach. Unfortunately, the crystal ball for 2013 is cloudy...here's one opinion from Seeking Alpha, but there are an equal number that argue for a true bull run this year.  Our goal is to prepared for whatever the market gives us and to grow our portfolios with minimal risks.
To accomplish these ends I intend to suggest several ways to use the T2 and T6 software in the coming month.  This will vary from the simple to the more complex, but with the software tools in hand you are free to pursue whatever strategy suits your needs and comfort level.
Although the Mosaic path has explored varied trails of capital appreciation over the past 6 months our focus has not changed...a modified market neutral model to temper risk and follow up trending investment instruments.  The move to T6 follows that focus and will enable considerably more user control than the LM and AB models, which will also be retired in March since they can be replicated in T6 and tracked on a daily basis without relying on Newsletter postings.


Thursday, May 23, 2013

T2 versus T11 on SA Model...5.23.13

OK...that was what is known as a key reversal day yesterday.  What today will bring is anybody's guess but we're starting out with a lot of red on the tape and some of the majors are taking heavy hits.
Good news for gold and bonds...for now.

In response to a subscriber question here's a look at the SA portfolio mentioned yesterday and updated as of Wednesday's close using a top2 versus a top 11 (all in) sort.
Remember...these are stocks forecast to outperform the SPY during 2013 so there's no delta or beta neutral buffer....these are supposed to be the best of the best...so no hedging our bets in this portfolio and risk management for this type of model is definitely a must.

Yesterday's action was actually a timely opportunity to test the validity of a 100% bullish concept (SA)  as we can see that the top 2 sort suffered a big hit while the all in model's loss was moderate.  (CSCO alone lost 2.5% yesterday). Now, this isn't an endorsement for the Seeking Alpha portoflio...I have no financial relationship with them...we're just looking at the argument for supporting a diversified bullish portoflio..even when things start to fall apart. A followup lookback tomorrow should be instructive.

Note that the equity line in both the top 2 and top 11 sorts has crossed through the P6  and now approaches the RSQ stop line. The top 2 sort looks grimmer than the top 11 model, but this could change quickly and strict observance of stop settings is (as always) strongly recommended.

Click once on each chart to enlarge and clarify.

Thursday, April 11, 2013

Wall Street stocks on T2...4.10.13

As a companion to the Seeking Alpha model, early in 2013 I posted a portfolio of the top 10 stocks that various Wall Street gurus had predicted would lead the markets in growth and returns.
Since we haven't revisited that model for a while yesterday's pop to new all time highs in most of the indices seemed like an opportune time to do so.
This is a top 3 sort and you can play around with the various top # sorts at your leisure to explore other scenarios. Most of the sort look like good bets.
MSFT, which has been in the top 3 rankings for the past 9 days,and which had a big run up in the past couple days is hit with a 5% downswing today (HP is down 6%) on reports of dwindling PC sales ...everybody now wants handhelds. 
XRT (the retail sector ETF) is the runner today...up an amazing 2.25% in early going and sure to crowd into the #1 ranking of the X sector T2 model if momentum can be sustained.
Meanwhile....the markets are at another new high 90 minutes in on a rising NYSE advance/decline line.
If you have an difficulty seeing the T2 charts, clicking on the chart once should enlarge and clarify the image.

Wednesday, May 22, 2013

SA Update.. 5.22.13

At the beginning of the year I mentioned a stock portfolio created by the Seeking Alpha group...its all stocks and not the usual focus of my ETF explorations, but reader interest prompts me to update the results.
Since stocks tend to be considerably more volatile than ETFs we should expect the drawdown metrics to be more unstable than the benchmark SPY.....this does not appear to be the case with this particular group of stocks.
Just for amusement I've noted a top 1 sort and a top 2 sort.  Over the longer term the #1 ranked stocks tend to have "runs" that typically last 5 to 10 days, although O's  (Realty Income) recent run extended 30 days and CSCO's previous run was 45 days, so frequent trading of positions, while expected, is not necessarily a function of the portfolio.
And now a top 2 sort.  Click once on each chart to enlarge and clarify.

Friday, February 1, 2013

T2 Study Updates..2.1.13

An interesting interview with Kyle Bass this morning on CNBC in which he noted that the technical long/short correlation of stocks and bonds has fallen apart and continues to deteriorate.  The practical implication for investors is that the search for superior portfolio components needs to be rethought to include different asset groups that are more focused on true capital appreciation potential.  This is a huge subject and we'll touch on some possible areas of exploration in future posts.

Here are updates on 3 T2 models that have been profiled previously:
COM:  a commodity based model
(note the COM benchmark is AGG (bonds) just to avoid SPY as a viable component)
SA:  a model comprised of top ranked stocks from Seeking Alpha
WS: a model comprised of top ranked stocks for 2013 from Wall Street analysts
Note that GE is in the current top 2 slots in both the SA and WS models.
Meanwhile, energy continues to dominate the commodities model.  (IGE is a blend of natural resources)

Thursday, July 18, 2013

SA Model Shows Slight Edge...7.18.13

Looking at today's clsing prices in the SA (Seeking Alpha) model confirms that the all in original portfolio can be improved by using a top 2 sort approach.
The 1 and 2 year returns can actually be improved significantly by using a top 1 sort although it is recommended that in order to accomplish these returns a daily rotational strategy be followed in lieu of our default weekly trading model.  This more frequent trading model may incur substantially higher commission costs than weekly trading and should be carefully considered before undertaking.
On both the 2 year and 4 month charts the SA top 2 sort model is bullish. 
Watch the P6 slope.

On the SPY TrendX in the right panel we are once again at an overhead resistance level and a breakthrough of that level would be significant.

Meanwhile, as predicted by the T2 indicators, XLF is running hot based on stellar earnings reports from the big 4, C, JPM, WFC and GS. 
Click once on chart to clarify.