TLT continues to run while GLD is actually showing some weakness.
Looking at the big picture makes one wonder what catalyst will pull the markets out of the current funk.
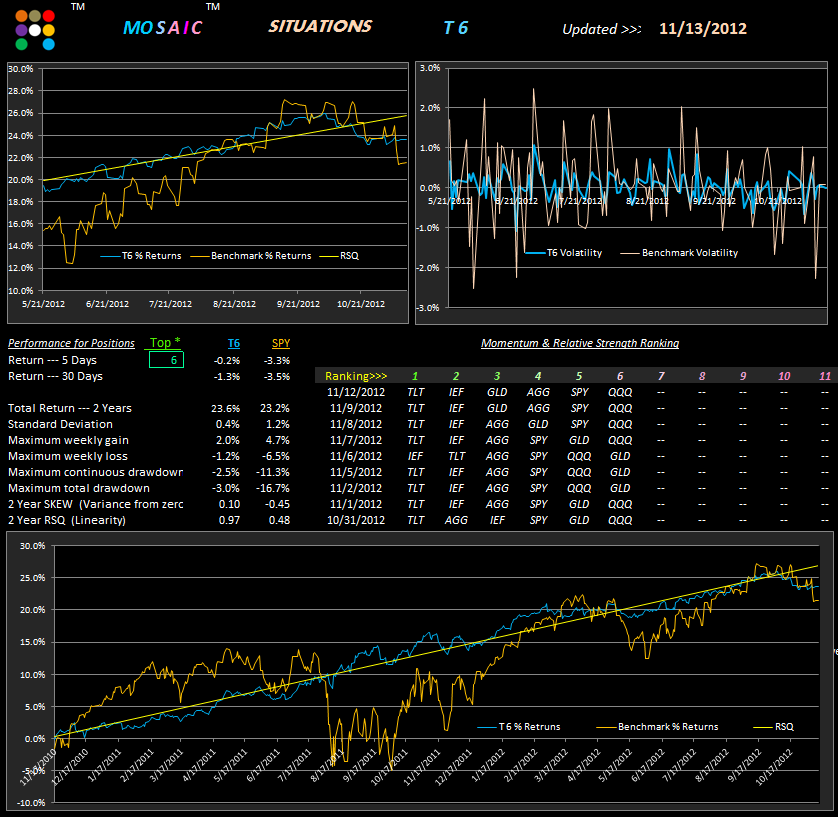
Note the TrendX view of the SPY at the right panel.. This is a daily bar real time chart and the outlook is ominous as the indicator hits new lows. Keep in mind that the TrendX is based on the moving pivot of price (H+L+C/3) which gives a more meaningful view of momentum than simply looking at closing values (at least I think so)
For the truly lazy who are interested in the Lazy Man T6 version, the current stats are shown below. While just barely keeping up with the SPY in total returns the beauty of this setup is that you just hold all 6 in equal dollar amounts, rebalance monthly and watch the RSQ stop. You don't even need to concern yourself with the momentum rankings. It's the very tight drawdowns that make T6 an attractive option for those IRAs and forever accounts where capital preservation is a dominant concern.
Regarding the RSQ stop... since the RSQ is so high...97%..the equity line will always straddle the RSQ line, so to avoid whipsawing and still reap the benefit of the RSQ stop one approach is to stop the position when the equity line falls more than 1.3%, slightly more than the maximum weekly loss.