T2 is still stopped as Friday's ranking switch to GLD as #1 is taking a little drawdown. As of 90 minutes today we had the same market volume as Friday's session. TLT is the winner this morning as it holds above its RSQ line.
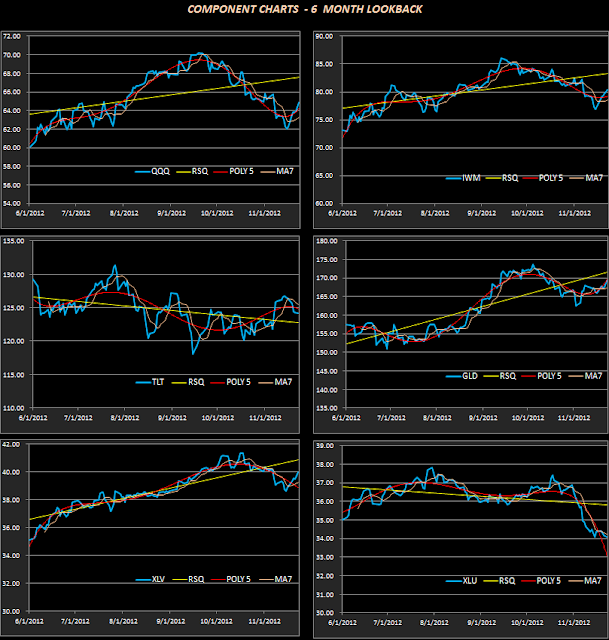
In order to make the stop or no stop decision making progress a bit more quantified (and less discretionary) this is a new chart format for the T2 (and other model) components. One problem in showing a screen shot of the actual chart file is that I can only show 6 at a time although there are 11 charts stacked up. The intent is to give a description of what is going on. Getting the full power of the chart signals is best accomplished if you have the software in hand, which is just another argument for making the program available to users. This will involve a re-formatting of the whole newsletter concept and I'll be posting on that over the next few days to solicit input and to move forward with providing an analytical package that is truly useful.
The 2 charts on the T2 front panel are based on incremental % change on a daily basis.
The 11 component charts (6 are shown above) are based on daily price fluctuations.
By now you should be familiar with the RSQ lin, which is essentially a linear regression line.
To supplement that line I've added a simple 7 day moving average (orange) and a polynomial (5th degree) (red). The polynomial function approximates the trending behavior of the moving average, but smooths out the signal and provides a clearer view of momentum than the moving average.
When we examine a few of these charts...say QQQ...we see that the Poly5 is a good indicator of imminent momentum. If the Poly5 is upslope price tends to increase, if the Poly5 is downslope then price is fading. Furthermore when the Poly5 crosses the RSQ line, either up or down, price tends to follow suit and we may submit that such a downward cross in any of the components would create a high probability stop.
We'll look at some more nuances of this chart setup as the week progresses while I try to figure out how to show the full 11 chart portfolio in a single screen shot.

