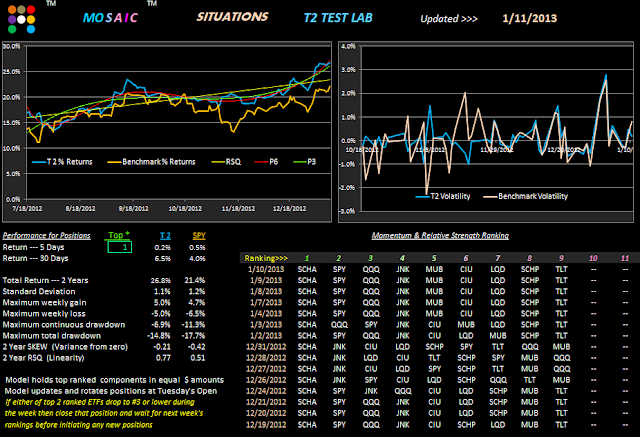
This is continuation of yesterday's test model...but we've added QQQ to the portfolio just to see how returns and volatility are affected.
Looking at a top 1 study the new 2 year returns with QQQ are upped by 4% and total max drawdown is also upped 2%. This pop in volatility can also be seen on the relative SKEW values for the 2 models.
With this increase in volatility the logical question is."how to avoid it"?
A look at the 2 year performance chart gives us a good starting point for controlling our risk exposure.
As usual....we're looking at the SPY action in orange and the top 1 model in cyan. This is clearly a much more volatile chart that yesterdays top 8 composite chart and there's considerable more trading involved to generate the projected returns. One way we can make the whole job easier is to follow our stops (old story, same story), including the RSQ and P6 (and the P3).
Our general trading guidelines and basic premises include:
Long crosses above the RSQ; CASH for crosses below the RSQ.
And/or...Downsloping P6 warrants CASH; upsloping P6 supports Long positions.
Sometimes the RSQ and P6 signals are not in sync and the P3 may provide some guidance in clarifying the likely longer term trend. This guidance is muddied by the fact that we are always focused on following an upward sloping RSQ which, given the longer period of the P3, will always produce lagging returns.
So let's use P3 and P6 together. Looking at the 6 instances of P3 and P6 crosses below we can visually see that following a tactic of using P3 as a stop for the P6 slope, either up or down, avoided a major drawdown period while keeping the position in CASH during periods of consolidation.
The price to be paid for this safety net was the loss of equity during the 8/11 and 9/11 period.
But there's a solution to that giveback also.
It's simply following the 6 month indicator chart on the main metrics panel of T2 (top of the page).
This 6 month chart produces an entirely different scale of analysis than the 2 year lookback and let's us apply the same tactics in a much shorter time frame.
As you might expect, we'll look closer at this dual time frame approach in upcoming posts.


