This is the follow up a previous Schwab no-fee SCHB model post.
Keep in mind that the model strategy buys 3 day lows and hols until that 3 day low price is exceeded...and we use a .6% limit stop to contain drawdown.
We noted in the previous post that although the one year returns were attractive the 2 year returns lagged a buy and hold approach.
(recap shown in first table below)
So how do we improve overall returns? The answer is quite simple.
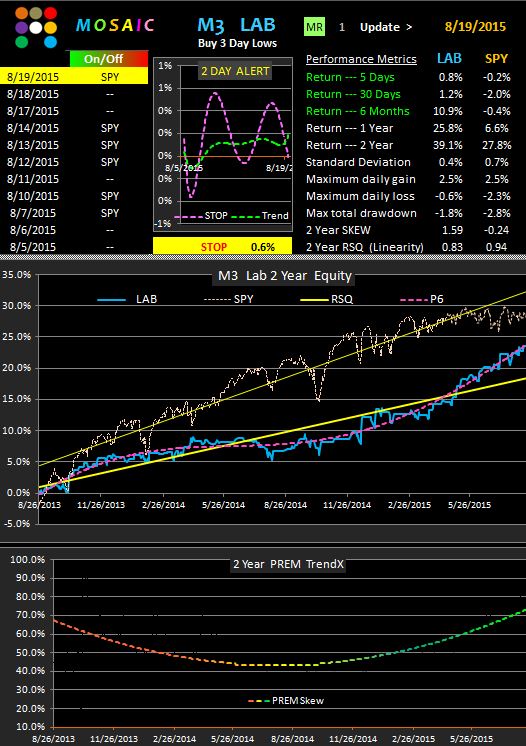
We track the performance of a buy and hold momentum model versus our 3 day pullback model. When price momentum is surging we suspend the 3 day low filter and just follow a buy and hold strategy but still applying our .6% limit stop. How do we determine when to turn the 3 day filter on? We use a simple net difference chart of a buy and hold versus 3 day low prices and then apply a second degree polynomial (the code is resident in EXCEL)...which yields a powerful graphic indicating the highest odds for either approach (red line sloping down means follow buy and hold, green line sloping up means our 3 day low model has the advantage for superior returns.)
The results of applying this rather simplistic tactic to improve investment returns are shown in the second table and chart below.
Yes...the graphics show SPY, but the exact same returns are generated when we use SCHB. And they say there's no free lunch.
For the next month you can see other trading ideas similar to this for free at the Mosaic site. The login password has been suspended so you can follow the daily market updates at 12:45 PM PST